Global Site
Displaying present location in the site.
Optical Sensor Technology Supporting the Climate “SHIKISAI” (GCOM-C) Satellite and Its Achievements
Sensing Technologies Underlying Social Systems: Sensing Technologies That Work Behind the Scenes PDF
PDFTo achieve the sustainable development goals (SDGs) aimed at solving issues common to the entire world, Earth observation satellites are becoming more and more important for monitoring the environment and assessing disaster situations on a global scale. Since developing Japan’s first satellite-borne optical observation sensor, NEC Corporation has built a strong track record in developing optical sensors for use onboard satellites. In this paper, we provide an overview of the hardware and the in-orbit achievements obtained with these technologies. Specifically, we focus on the multi-wavelength optical radiometer onboard the Global Change Observation Mission – Climate “SHIKISAI” (GCOM-C) launched in 2017; the hyperspectral sensor for space demonstrations installed on the International Space Station in 2019; and the sensors onboard the Greenhouse Gases Observation Satellite “IBUKI” (GOSAT), which has been in operation since its launch in 2009.
1. Introduction
Momo-1, Japan’s first marine observation satellite, was launched in February 1987. Momo-1 was equipped with the multispectral electronic self-scanning radiometer (MESSR), developed by NEC as Japan’s first radiometer for measuring visible near infrared radiation. For more than 30 years since the development of MESSR, NEC has been providing optical sensors for countless satellites, including Earth observation satellites, scientific satellites, and the International Space Station. The optical sensors (radiometers) developed by NEC are capable of measuring radiation in the ultraviolet, visible and infrared wavelengths. This paper introduces the most recent hardware for optical sensor systems developed by NEC and provides an overview of their in-orbit achievements.
2. Multi-wavelength Optical Radiometer SGLI Onboard the SHIKISAI
The Second-generation Global Imager (SGLI) is a multi-wavelength optical radiometer system mounted on the Global Change Observation Mission – Climate “SHIKISAI” (GCOM-C), which was launched on the H-IIA rocket from Tanegashima Space Center on December 23, 2017. SGLI will be observing aerosols, ocean color, vegetation, snow and ice around the globe for a period of five years.
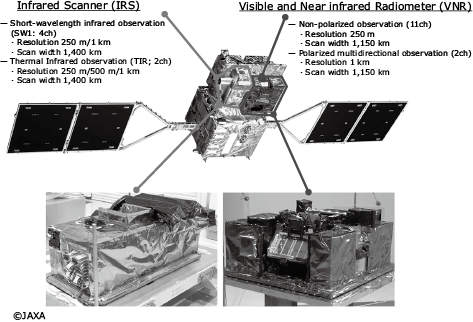
SGLI is a successor of the Global Imager (GLI) aboard Midori II (also known as ADEOS-II). It is composed of two radiometer components – the visible and near infrared radiometer (VNR) and the Infrared Scanning Radiometer (IRS) (Fig. 1), and has been enhanced with two major new features – resolutions of 250 m to 1 km and polarization/multi-directional observation capabilities for obtaining land aerosols and other observation data.
SGLI is capable of global-scale observations of physical quantities associated with climate change, such as ocean color and vegetation that are calculated using the radiance data retrieved by the radiometers at specific wavelengths. As of 2021, SGLI has been in orbit for three years, and has contributed to achievements in various fields.
The possibility of obtaining detailed measurements at a resolution of 250 m of snow/ice distribution, snow/ice surface temperature and snow grain size in the observation of glacier melts in the Arctic and Antarctic areas, which are closely associated with climate change, is expected to bring advancement to the numerical models and improve the accuracy of climate change predictions1).
SGLI can also observe the density of dust and sand storms (DSS) and PM2.5, which are types of aerosols. In particular, the polarized observation function provided by SGLI enables detection of fine particles such as PM2.5, which is helping to advance research on improving prediction accuracy. In Fig. 2, the figure on the left is an image close to one as seen by the naked eye and the figure on the right is an image based on observation of polarized radiance (land only). They show that the darker the image, the higher the concentration of small particles2).
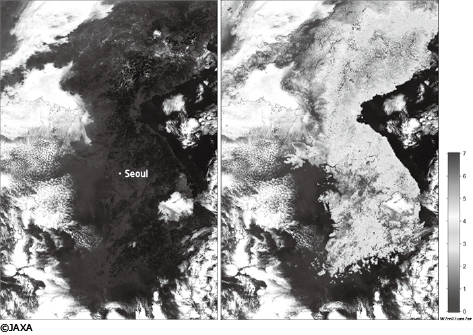
Image close to that seen by the naked eye (left), and observation of polarized radiance (right).
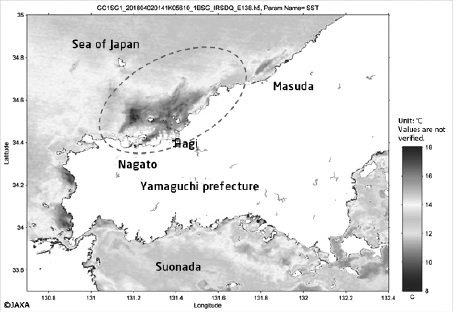
In the field of fishery, the ocean colors representing the density of phytoplankton and the ocean surface temperature are used to predict fishing grounds and to understand the occurrence and movement of red tides (Fig. 3). In particular, the 250 m resolution enables observation of the situation in coastal areas, which was previously impossible, and is expected to contribute to the aquaculture industry.
3. Hyperspectral Imager Suite “HISUI” for Space Demonstration
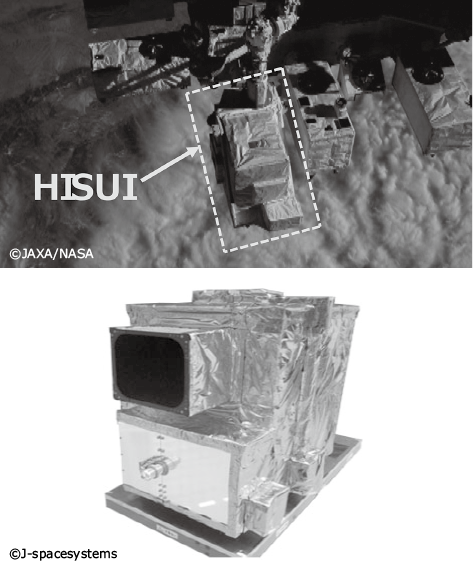
The Hyperspectral Imager Suite “HISUI” (Fig. 4)4) is an optical sensor for spectral observation in continued wavelength bands for detailed classification of plantation and minerals for the purpose of securing a stable supply of energy and resources. It was launched on December 6, 2019, and installed on the Japanese experiment module, called “Kibo,” of the International Space Station. HISUI is equipped with a reflective telescope; two highly efficient grating spectrometers covering the visible and near infrared region (VNIR: wavelengths of 400 nm and 970 nm, respectively) and short wavelength infrared region (SWIR: wavelengths of 900 nm and 2,500 nm, respectively); and a low-noise two-dimensional detector and signal processor. This design makes possible spectrometry in 185 bands of continuous wavelengths from the visible to short-wave infrared regions with high wavelength resolution (VNIR: 10 nm, SWIR: 12.5 nm). The spectrometric data has higher land surface resolution (20 m x 31 m) and higher SNR (VNIR: 450 @ 620 nm wavelength, SWIR: 300 @ 2,100 nm wavelength) compared to the results achieved in projects conducted by competitors overseas.
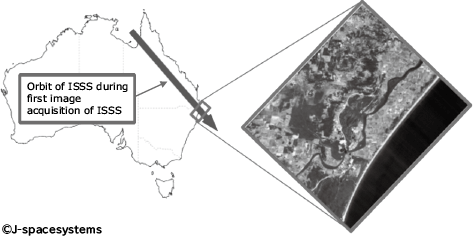
After obtaining the initial-stage image shown in Fig. 5 in 2020, the HISUI transited to initial-stage operation. It has stored spectroscopic data covering wide regions of the earth as of 2021. Up to now, the multispectral sensor capable of observing a dozen or so bands has been used most frequently among the optical sensors for use in global-scale land area observation. Going forward, however, the spectral data of the continuous 185 bands from the visible to short-wave infrared regions obtained with the HISUI is expected to be used more frequently in identifying the distribution of minerals in the field of resource research and the condition of vegetation in the field of environmental/agricultural research.
4. Thermal and Near Infrared Sensor for Carbon Observation TANSO on “IBUKI” (GOSAT)
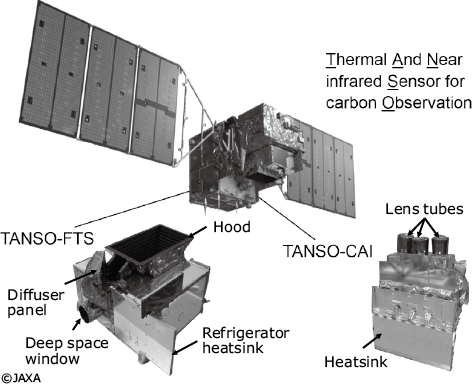
Thermal And Near-infrared Sensor for carbon Observation (TANSO) (Fig. 6) is the world’s first sensor having the main purpose of observing from space the concentrations of major greenhouse effect gases including carbon dioxide and methane. It was launched on January 23, 2009, on the Greenhouse gases Observing Satellite (GOSAT). TANSO is composed of two observation sensors: the Fourier Transform Spectrometer (FTS) and the Cloud and Aerosol Imager (CAI). TANSO-FTS can observe a wide range of wavelengths from the near-infrared (wavelength 0.76 µm) to thermal-infrared (wavelength 14.3 µm) with a single unit. It can measure gas absorption spectra of the solar rays reflected on the earth’s surface and the thermal infrared radiation (TIR) emitted from the ground and the atmosphere with high spectral resolution. It also has a pointing mirror that is driven around two axes, allowing it to direct the earth observation point and calibration source quickly and with high accuracy, as well as to compensate for satellite motion during one data acquisition (4s) to orient towards the same point. TANSO-CAI is a radiometer covering the UV, visible, near-IR and short-wave IR regions. It is used to obtain more accurate data than TANSO-FTS by identifying the clear-sky area found with TANSO-FTS and obtaining the optical characteristics of the clouds and aerosols.
The overall functionality and performance of TANSO are still good even after the 5-year mission period and no major degradation has been found. The characteristics and changes observed in the hardware in orbit have been addressed by updating the data processing algorithms on the ground so TANSO can continue to provide optimally calibrated data. The accuracy of the greenhouse gas concentrations obtained using data from TANSO are -0.35 ±2.19 ppm (-0.1 ±0.6%) for carbon dioxide and 2.2 ±13.4 ppm (0.1 ±0.7%) for methane as of March 20217), which greatly exceeded the initial success criteria (3-month average relative accuracy of carbon dioxide 1%, methane 2% in a 1,000 km mesh).
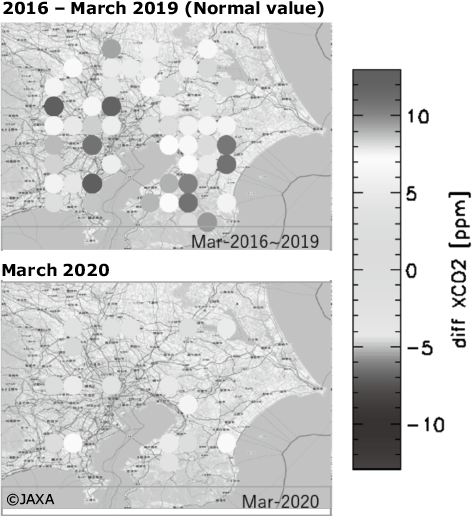
When TANSO carbon dioxide concentration data in 2020 for Tokyo is compared with the average values from 2016 to 2019, it shows that the increase in the carbon dioxide concentration in 2020 was lower than in normal years (Fig. 78)). The intensive observation points of TANSO are shown as circles covering a field of view of about 10 km diameter. The change in the level of increase of carbon dioxide concentration is thought to be influenced by the decrease in fossil fuel consumption due to the COVID-19 pandemic8).
As of March 2021, TANSO has continued in-orbit observations for over 12 years, providing homogeneous greenhouse gases concentration data. In order to develop effective measures to reduce greenhouse gas emissions, simply obtaining the concentration data is not enough but it is also important to calculate the emission quantity per emission source type. As of March 2021, which marks 12 years since the launch of TANSO, research is being advanced to optimize the sampling method for obtaining maximum information from the TANSO data and to calculate the emission quantities. This is expected to contribute to the global stocktake established under the Paris Agreement and scheduled to start in 2023.
5. Conclusion
In this paper, we provided an overview of the hardware of the optical sensor systems that NEC has developed in recent years, as well as the results achieved in orbit. Products such as physical quantities obtained from the data provided by the optical sensors are contributing greatly to monitoring the global environment, improving the prediction accuracy of climate change, and promoting real-world applications in aquaculture and other industries.
We would like to express our deepest gratitude to the Ministry of Economy, Trade and Industry (METI), Japan Aerospace Exploration Agency (JAXA), Japan Space Systems (J-spacesystems) and other related organizations for their guidance in the development of these optical sensor systems.
NEC will continue to provide optical sensors for use onboard satellites, and through the products they produce, contribute to the realization of social infrastructure that provides safety, security, fairness and efficiency, and to the achievement of the SDGs that aim to deliver solutions to social issues common to the entire world.
Reference
- 1)
- 2)
- 3)
- 4)
- 5)
- 6)
- 7)
- 8)
 JAXA: Seen from Space 2019
Authors’ Profiles
YOSHIDA Jun
Manager
Public Infrastructure Planning Division
Member of the Society Of Geomagnetism And Earth, Planetary And Space Sciences (SGEPSS)
Manager
Public Infrastructure Planning Division
Member of the Society Of Geomagnetism And Earth, Planetary And Space Sciences (SGEPSS)
UCHIKATA Tatsuya
Expert Engineer
Space Systems Division
Expert Engineer
Space Systems Division
ITOU Yoshiyuki
Assistant Manager
Space Systems Division
Assistant Manager
Space Systems Division