Global Site
Displaying present location in the site.
Monitoring Infrastructure with Synthetic Aperture Radar (SAR) Satellite Service for Safe and Secure Society
Sensing Technologies Underlying Social Systems: Sensing Technologies That Work Behind the Scenes PDF
PDFNumerous satellites have been launched in the past few years, providing a broad array of invaluable data that is being used to support a rapidly expanding range of activities. For the most part, this data is optical image data, which cannot be collected under adverse weather conditions or at night. Recently, synthetic aperture radar (SAR) ― which uses microwaves ― has begun to attract attention as a possible solution. Among other things, SAR makes it possible to measure ground surface displacement with high precision across a wide range. NEC adapted this technology to create a service to visualize deterioration and displacement of buildings, bridges, and other infrastructure. However, because SAR image data does not provide an image comprehensible to the human eye, it must be used in conjunction with various analysis technologies. In this paper, we will introduce these add-on technologies and outline the infrastructure maintenance service offered by NEC.
1. Introduction
Data collected by Earth observation satellites using radio waves, infrared rays, and visible light, has thus far been used only in specific areas such as weather, defense, and disaster prevention. This is now changing. The costs associated with building and launching satellites have fallen steadily over the past few years. Thanks to improvements in real-time property and the achievement of big data analysis, satellite data can now be utilized in a much broader range of applications, including agriculture, resources, energy, finance, and infrastructure monitoring. Most Earth observation satellites now in orbit incorporate optical sensors that generate images easily comprehended by human eyes. It is in this respect that satellites incorporating synthetic aperture radar (SAR) ― which utilizes microwaves that have superior features than those of optical sensors ― caught the attention of those seeking to obtain more comprehensive coverage. Many venture companies are now planning large-scale projects aimed at building a constellation* of SAR satellites.
Besides obtaining images even under adverse weather conditions and at night, SAR technology can also obtain phase-based distance measurements. However, because raw SAR image data cannot be visualized by the human eye, it must be processed with a variety of analysis technologies in order to produce usable images. NEC has developed an infrastructure monitoring service that incorporates these analysis technologies to produce actionable images in critical areas such as infrastructure maintenance and management, as well as disaster prevention and disaster risk reduction. This paper outlines this service and describes the analysis technologies used to augment the SAR system, following with a discussion of a couple of case studies that exemplify this service in practice.
- *A group of satellites working together as a system so that the satellites operate in a coordinated manner.
2. Principles of SAR Satellite and Analysis Technologies
2.1 Principles and overview of SAR
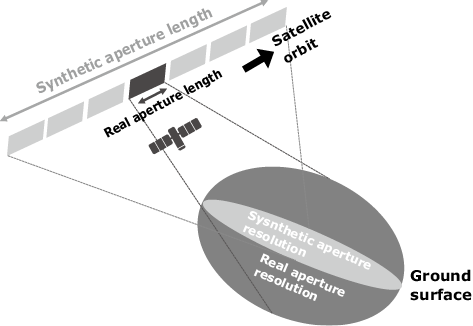
SAR radiates microwaves to the ground from an antenna mounted on a flying vehicle such as an artificial satellite. An active sensor generates images using reflected waves from a target object. Usually, the larger the antenna, the higher the resolution. To improve the resolution, the SAR system repeatedly transmits and receives the microwaves while tracking the movement of the satellite, thus creating a massive virtual antenna. Fig. 1 shows an overview of a SAR satellite system. SAR can also be installed in other flying vehicles such as airplanes. The system discussed in this paper is a satellite system whose stable orbit due to less air resistance ensures more reliable cyclic observation.
Examples of optical and SAR images are shown in Fig. 2. These images show a section of a city. An optical image is shown on the left and a SAR image is shown on the right. In the SAR image, the intensity information of reflected waves is shown in black and white. Areas where reflected waves are strong are rendered in white, while areas where reflected waves are weak are rendered in black. You can tell from the difference in wavelength and resolution between these two pictures that the SAR image is more difficult to visualize than the optical image. However, by applying various analysis technologies you can obtain a number of advantages only available from SAR images.
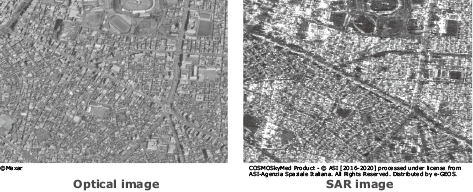
For example, since microwaves can penetrate clouds, observation is possible irrespective of day or night and weather conditions. Also, very slight displacements on the ground surface can be extracted by performing interferometric analysis (see below) of the phase information included in SAR images.
2.2 Interferometric analysis technology and infrastructure monitoring service
NEC’s SAR infrastructure monitoring service offers two main types of analysis. The first type is change detection analysis which examines SAR images from two different periods and detects the sections where strength information has changed significantly. This is effective for detection of new construction and demolition of buildings as well as pre-disaster and post-disaster flooded areas. The second type is time-series interferometric analysis that detects very slight displacements from phase information. The time-series interferometric analysis is outlined below.
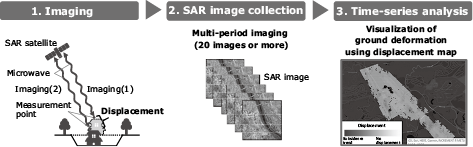
The flow from imaging to analysis in time-series interferometric analysis is shown in Fig. 3. Time-series interferometric analysis reduces various noise components by analyzing more than twenty SAR images captured in the same location and under the same conditions (orbit, incidence angle, observation mode, etc.). By focusing on phase changes in artificial structures that have strong reflections ― based on the fact that sections with stronger reflected waves always have more stable phases, this analysis can calculate displacement rate (mm/year) of ground surface with millimeter-level precision. By visualizing these analysis results, we are able to generate accurate displacement rate maps. Furthermore, because the use of displacement information in each time series makes it possible to calculate the displacement (mm) on each imaging day, we also offer the displacement maps that visualize the amount of fluctuation over time. Thus, SAR satellite imaging makes possible comprehensive visualization of displacement on ground surfaces across an extremely wide range.
2.3 Principles of time-series interferometric analysis
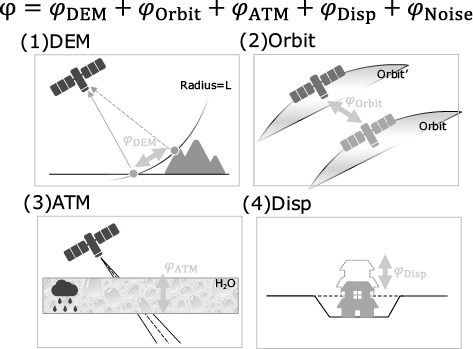
The principles to extract displacement information from phase information obtained from SAR images are as follows. The simplified formula of phase information in time-series interferometric analysis is shown in Fig. 4, where φ is the observed phase information, φDEM is the phase component generated by the relief of the terrain, φOrbit is the phase component generated by the orbital difference of the satellite, φATM is the phase component of the microwave delay caused by the atmosphere and ionosphere, φDisp is the phase component generated by the displacement of the ground surface, and φNoise is other random noise. To extract the displacement of the ground surface φDisp from time-series interferometric analysis, each phase component is estimated from the observed φ and then eliminated. For instance, the phase model for φDEM is estimated based on a digital elevation model (DEM) generated from an aerial laser survey, φOrbit is estimated from the orbit data of the satellite, and φATM is estimated based on the feature that is randomly varying along the axis of time and smoothly varying along the axis of space.
These phase models must be correctly estimated in order to calculate the displacement information (φDisp) with maximum precision. NEC has been actively engaging in R&D efforts aimed at improving measurement accuracy and has developed several methods we believe are capable of fulfilling this goal. One method involves clustering measurement points to evaluate the similarities between peripheral pixels and time-series phases1), another uses space-time phase unwrapping2) to measure nonlinear displacement, while a third divides displacement into vertical and horizontal (east-west) directions based on displacement information observed from two orbits (ascending and descending)3). The most optimal method is applied depending on customer requirements and other conditions.
3. Infrastructure Monitoring Service Usage Cases
3.1 Background
The high economic growth period saw massive construction of social and social infrastructure, including roads, bridges, tunnels, railroads and more. Today, more than half a century later, much of that infrastructure is showing signs of age and, in many cases, significant deterioration. Managing this involves a repetitive cycle of inspect, diagnose, repair, and record. Assessing the degree of deterioration accurately is critical as determining where deterioration is advanced presents a high degree of urgency.
Conventional methods in which visual inspection and survey tasks are mainly performed on the site may be impacted by worker shortages and conflict with the teleworking trend that has arisen during the coronavirus pandemic. To improve efficiency, it is necessary to reduce the number of inspection targets that need to be examined by humans and prioritizing them.
None of these issues affect NEC’s SAR-based infrastructure monitoring service, which can visualize the displacement information across a broad spectrum and capture any evidence of abnormal displacement of infrastructure. This capability makes it possible to prioritize designated inspection targets and execute preventive maintenance to forestall collapse of infrastructure and to stop other accidents from happening.
3.2 Usage examples
This service is currently used by owners of infrastructure in various industries. These include energy (gas and power companies), construction (general contractors, developers, and consulting firms), transportation (airports and harbors), financial (non-life insurance companies and banks), national and local governments (roads and bridges). Because this service features wide-area coverage, high cost effectiveness can be expected when the customer owns a lot of infrastructure. To illustrate how the system works, we discuss examples of analysis conducted in a tunnel construction area and an airport area.
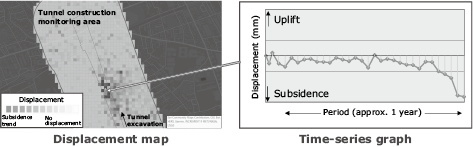
The analysis example of a tunnel construction area is shown in Fig. 5. In tunnel construction, it is necessary to recognize any displacement in the construction site and the surrounding area over an extended period. Usually this is achieved by surveying the site. NEC’s SAR-based infrastructure monitoring service makes possible surface confirmation of land displacement before, during, and after construction. In other words, it is possible to check the soundness of the construction. It is also possible to adjust the observation frequency in accordance with the construction phase. Additionally, the SAR satellite accumulates data from various locations. So retrospective analysis is possible as long as data exists in a particular area, which makes it well-suited to tunnel construction.
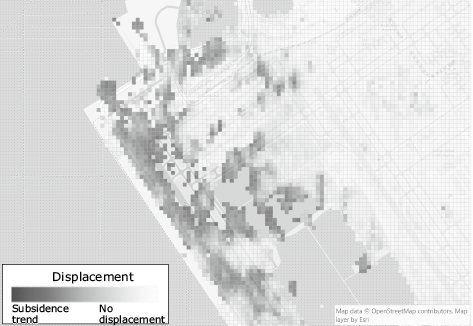
An analysis example of an airport is shown in Fig. 6. Parts shown in dark gray represent minus (subsidence) and parts shown in light gray represent areas where there is almost no displacement. Areas likely to subside are usually surveyed periodically. However, due to budgetary constraints, only discrete displacement measurement is performed in most cases. This service makes possible surface displacement measurement so it can be used to supplement the survey.
4. Promotion of Digital Transformation (DX)
Maintenance and management of infrastructure not only requires regular inspections, it also requires continuance of all aspects of the maintenance cycle including diagnosis and recording. Unfortunately, these tasks have not yet been incorporated in this service. However, by combining multiple technologies, NEC is working to achieve a digital transformation (DX) focused on the creation of a more advanced service for infrastructure maintenance and management.
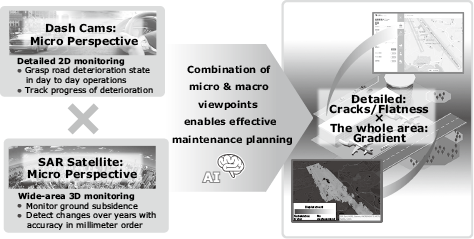
An example of how these various technologies could work together is the concept of linking to Kurumie for Cities as shown in Fig. 7. Kurumie for Cities is a new solution from NEC that can discover abnormalities on road surfaces and other surfaces by using images from dash cams attached on cars and image analysis technology of artificial intelligence. It can detect cracks on road surfaces that cannot be detected by satellites. Users can prioritize the order of repairs and record comments from local residents and repair results. By combining the macroscopic viewpoint of SAR’s infrastructure monitoring and the microscopic viewpoint of Kurumie for Cities, we anticipate that anomaly detection accuracy will be improved and the effective infrastructure maintenance management cycle will be achieved.
5. Conclusion
In this paper, we described about NEC’s SAR satellite infrastructure monitoring service. By combining this system with other technologies and by continuing our R&D efforts, we are confident that we can continue to add value by improving measurement accuracy and using big data analysis. Working closely with our partner companies, customers, and other stakeholders, we are committed to developing sophisticated digital solutions that contribute to people’s safety and security and help propel the ongoing DX.
Reference
- 1)TANAKA Taichi, HOSHUYAMA Osamu: Persistent scatterer clustering for structure displacement analysis based on phase correlation kernel, EUSAR 2018, 2018.6
- 2)TANAKA Taichi, HOSHUYAMA Osamu: Cluster Based Method to Identify Persistent Scatterers for Nonlinear Displacement Analysis of Structures, IGARSS 2018, 2018.7
- 3)IKEFUJI Daisuke, TANAKA Taichi, HOSHUYAMA Osamu: Two-Dimensional Displacement Analysis Of Buildings Based On Persistent Scatterer Clustering And Map Data, IGARSS 2019, 2019.7
Authors’ Profiles
OHNO Shouhei
Assistant Manager
Radio Application, Guidance and Electro-Optics Division
Assistant Manager
Radio Application, Guidance and Electro-Optics Division
JUMONJI Nana
Radio Application, Guidance and Electro-Optics Division
Radio Application, Guidance and Electro-Optics Division
HIRATA Hiromichi
Assistant Manager
Radio Application, Guidance and Electro-Optics Division
Assistant Manager
Radio Application, Guidance and Electro-Optics Division
HASHIZUME Daisuke
Manager
Radio Application, Guidance and Electro-Optics Division
Manager
Radio Application, Guidance and Electro-Optics Division
ISHII Takakazu
Senior Expert
Radio Application, Guidance and Electro-Optics Division
Senior Expert
Radio Application, Guidance and Electro-Optics Division