Global Site
Displaying present location in the site.
The Introduction and Deployment of NEC's Smart Energy Management System- "Smartizing" Energy Management at Obayashi CorporationTechnical Research Institute and NEC Tamagawa Plant, Building 9 -
Vol.10, No.2 April 2016, Special Issue on NEC's Smart Energy Solutions Led by ICTYear after year, unit prices of electricity in Japan have been going up, increasing the burden on ratepayers. To help electricity consumers manage their consumption and exert greater control over their costs, NEC has been pushing forward with the development of a Building Energy Management System (BEMS) capable of forecasting demand for electricity and controlling the facilities accordingly. In this paper, we will take a closer look at our electricity demand prediction system and show how we have elaborated on it to create a system that will help make operations smarter as exemplified by the system we configured for, and delivered to, Obayashi Corporation Technical Research Institute. Also introduced is another case study in which the knowledge gained from the Obayashi Corporation deployment was applied to NEC Tamagawa Plant, Building 9.
1. Introduction
Unit prices of electricity in Japan have been rising steadily in recent years. The resulting rate increases have become a major issue for users.
Electricity charges are composed of two main components: a base rate that corresponds to the contracted power and a watt hour rate that corresponds to the consumed power. Typically, efforts to keep these costs down involve forcing a reduction in electricity consumption through such activities as by turning off or removing lights and lowering air-conditioning settings. In other words, in order to save money, comfort and convenience are sacrificed. While these methods can help reduce energy usage, we don't think that it is a smart way to manage a space where workers must function at peak efficiency on a daily basis. Instead, we believe that the most effective way to minimize electricity rates, while maintaining a comfortable, efficient workspace, would be to streamline power consumption so that rather than being concentrated at certain times of the day, it is dispersed throughout the day.
NEC is developing a system that forecasts power demand in buildings and offices with a very high degree of precision. By identifying those time periods where power usage is concentrated, the system enables consumption to be dispersed, taking the pressure off users to consciously limit their consumption.
2. "Smartizing" Energy Management and Overview of the System Installed at Obayashi Corporation Technical Research Institute
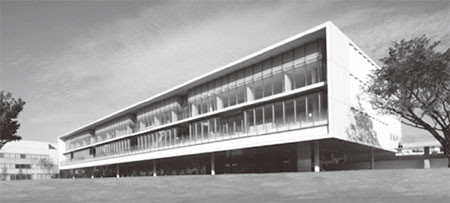
In January 2015, NEC smartized energy management at Obayashi Corporation Technical Research Institute (Photo) in Kiyose, Tokyo by introducing a system that makes it possible to forecast electricity demands and disperse power usage accordingly.
In addition to this system, large-scale power sources (photovoltaic generation facilities, micro-combined generation systems, and large-capacity batteries) were installed, as well as an energy management system (EMS). A reduction in contracted power of about 32% is anticipated when these systems are operating in conjunction with one another.
3. Power Demand Forecast Technology
To forecast demand for electricity, this system uses our Heterogeneous Mixture Learning Technology - one of various methodologies used to analyze big data. Its main features include high precision, automatic analysis and a clear calculation basis for the predicted results.
With this system, we have systematized electricity demand prediction using the Heterogeneous Mixture Technology for the first time. The outline of the system configuration is shown in Fig. 1.
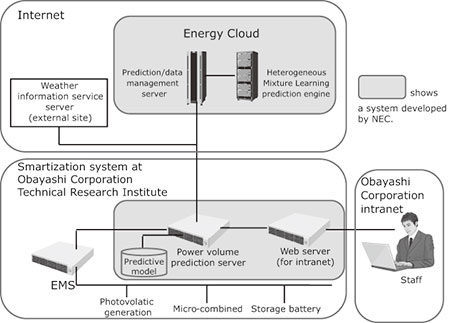
The data required to forecast electricity demand is collected from EMS and weather information service servers in the power volume prediction server, which analyzes the data using predictive models to generate a prediction.
When the predictive model itself needs to be reviewed or revised, the power volume prediction server data sends an update request together with the collected data to the prediction/data management server in the energy system's cloud. The prediction/data management server then recalculates the predictive model by communicating with the Heterogeneous Mixture Learning engine, returning the results to the power volume prediction server. By periodically reviewing predictive models this way, we can ensure that we are always using the latest, most up-to-date model. The prediction results are provided to the EMS which uses them as the basis for managing the energy system, optimally controlling the micro-combined generation systems and large-capacity batteries to prevent over-consumption of power.
This mechanism makes it possible for us to generate power demand forecasts with very high levels of accuracy.
4. Dispersing Electricity Consumption
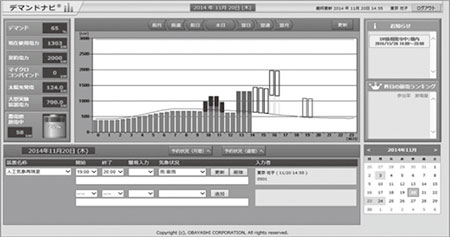
The forecast obtained by the functions described in the preceding section is shown on the Obayashi Corporation Technical Research Institute internal website. In addition to this, we have built a system called Demand Navi that optimizes management of electricity consumption in the institute. This uses a scheduling function that judges whether or not laboratories should be used on a reservation basis to avoid concentration of experiments that require a large amount of electricity and to postpone such experiments according to the value of predicted electricity demand. A sample screen from this system is shown in Fig. 2.
Detailed information about each experiment reservation is provided to the EMS, which uses the data to optimally control the micro-combined generation systems and large-capacity batteries to prevent overuse of power.
5. Demand Response
This system implements two demand response functions.
(1) In-house demand response
Whenever it appears likely that the contracted electricity amount will be exceeded, despite dispersal of consumption, an email is sent to all staff in the institute asking them to take measures to reduce power use.
(2) Community demand response
This system complies with the OpenADR 2.0b Profile Specification, which is an international standard for automatic demand response. Compliance with this standard enables the system to receive and comply with requests to reduce power consumption from external entities such as power companies.
6. Visualization
This system adopts AR (augmented reality) as well as a function to display current conditions in real time to achieve SCIM (Smart City Information Modeling) proposed by Obayashi Corporation. A sample screen from the system is shown in Fig. 3.
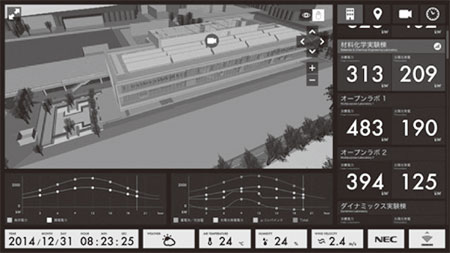
The screen shown in Fig. 3 is also an example of what is displayed on the Technical Research Institute's internal website. In the upper left part of the screen, 3D objects are displayed. Viewpoints can be freely changed and the image rotated as desired.
7. Future Deployment
The technology and know-how gained when this system was built has since been put to use in what we call the Tamagawa Smartization Project.
For this project, we built an energy-saving system at the NEC Tamagawa Plant, Building 9 in fiscal 2014. As with the Obayashi project, the goal in this case was to minimize power consumption without impacting the comfort of the work environment. A conceptual diagram of this system is shown in Fig. 4.
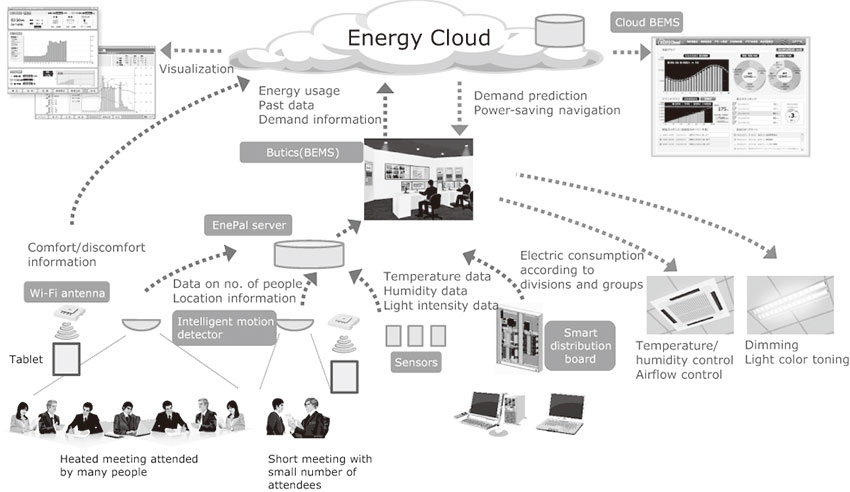
The two main features of this system are described below.
(1) Optimizing comfort based on the QoWL index
Based on NEC's original QoWL (Quality of Working Life) index, three kinds of data - room temperatures, subjective data of whether it's too hot or too cold, and communication activity ratios to measure the quality of operations - are collected in the energy cloud to calculate the comfort of the working environment.
When the communication activity ratios to measure the quality of operations are aggregated, intelligent motion detectors are used to determine where people are located and how many of them are gathered in specific areas. This makes it possible to fine-tune air conditioning output to ensure that people are comfortable and that energy usage is kept to a minimum.
(2) Power demand forecasting using the Heterogeneous Mixture Learning Technology
The energy cloud we built for this system is used to perform power demand forecasting for Building 9. A BEMS installed in Building 9 named Butics receives the power demand prediction from the cloud and then estimates the times of the day when the target values set in advance according to the forecast are likely to be exceeded. This makes it possible to determine when demand will peak and adjust facility operation plans beforehand in order to reduce energy use.
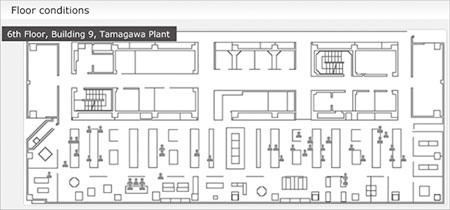
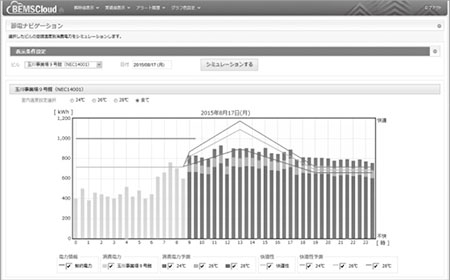
By combining these two elements (1) and (2), we have successfully created an energy-saving system that takes comfort into consideration. The aggregated results of the number of people and their location using the intelligent motion detectors are shown in Fig. 5. As shown in Fig. 6, the results of the calculations performed in the energy cloud can be checked from a web browser on a power-saving navigation screen. We intend to use this system as a basis for growing sales of our EMS in the future.
8. Conclusion
In this paper, we have shown how we developed a smartization system for EMS, which we successfully delivered to Obayashi Corporation and used as the basis for NEC's Tamagawa Smartization Project. We would like to express our gratitude to Obayashi Corporation for their cooperation in building this system.
- *Demand Navi and SCIM are registered trademarks of Obayashi Corporation in Japan.
Authors' Profiles
KITAMURA Mitsuhiro
Manager
Transportation and City Infrastructure Division
Manager
Transportation and City Infrastructure Division
YAMANAKA Yuya
Transportation and City Infrastructure Division
Transportation and City Infrastructure Division
IGUCHI Mamoru
Manager
Big Data Strategy Division
Manager
Big Data Strategy Division
ORITA Kazuhisa
Manager
Transportation and City Infrastructure Division
Manager
Transportation and City Infrastructure Division
SHIMADA Takashi
Manager
Transportation and City Infrastructure Division
Manager
Transportation and City Infrastructure Division
NAKASE Shunsuke
Transportation and City Infrastructure Division
Transportation and City Infrastructure Division