Global Site
Displaying present location in the site.
Optical Fiber Sensing Technology Visualizing the Real World via Network Infrastructures
Optical fibers used in the optical communication technology industry to support worldwide high-speed Internet have an information collection function that captures changes in the surrounding environments as well as performing the basic function of information transmission. NEC Corporation is currently conducting R&D of optical fiber sensing technologies that utilize optical communication infrastructures as sensors for visualizing the real world. It is doing this by combining the world’s top level optical communication technology cultivated via its experience in the submarine optical cable systems together with the latest AI technologies. The present paper introduces basic principles of the optical fiber sensor with system configuration and discusses three case applications: intrusion detection of facilities, surveillance of road traffic flow and bridge deterioration detection.
1. Introduction
Optical fiber networks are one of the critical communication infrastructures that support the high-speed Internet. NEC boasts several achievements that have supported the construction of the optical fiber network since the start of the optical fiber communications project. One example is the submarine cable system operations that were started in 1968 that have achieved several results, such as the laying and provision of terminal equipment for the Transpacific optical submarine cable system. The optical fiber sensor is a linear-shaped passive sensor that uses the optical fiber cable which is the information transmission medium, e.g. sensing medium, and is capable of sensing environmental changes such as vibration, strain and temperature near the optical fiber cable with identifying the locations of any changes. The optical fiber sensor has been improving performance following the advancement of the optical fiber communication technology. In addition, the rapid progress of AI technology in recent years has made it possible to provide in-depth visualization of the real world by analyzing and learning the data collected with sensors by applying AI technology. In section 2, we outline the optical fiber sensing technology and the detail of NEC’s technological contribution features. Section 3 discusses three cases of visualization of the real world, and section 4 presents a conclusion of the paper.
2. Introduction of Optical Fiber Sensing Technology
Fig. 1 depicts basic principles and system configuration of the optical fiber sensor. To enable the optical fiber cable that is originally the information transmission medium to work as a sensor, the sensing device is connected to one end of the cable. When a sensing pulse from the sensing device is launched to the optical fiber, a backscattering signal is generated from any point of the optical fiber. The sensing device detects the backscattering signals following the time series. When a vibration/strain is applied on the optical fiber cable or an environmental change such as temperature, the structure and characteristic parameters of the quartz glass material of the optical fiber change accordingly. Subsequently, the information of environmental changes will be carried by backscattering signals. The location of the backscattering signal is calculated by using the return time that is observed from the pulse sending and returning of that. The possibility of isolating observed points depending on time means that simultaneous detections of lights from multiple points are possible. The sensing signal is sending at a constant repetition frequency so that the backscattered signal from the furthest end of the optical fiber cable and the next sensing signal are not mixed. This procedure makes it possible to observe constant environmental changes at a single point.
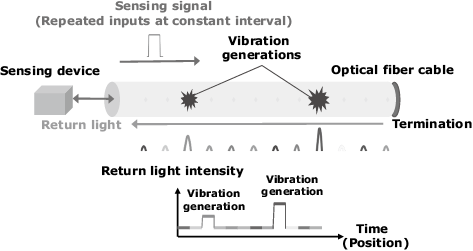
optical fiber sensor.
NEC’s optical fiber sensing technology has the following major features.
- Long distance/high distance resolution sensing:
The sensing technology applies the optical signal amplification technology developed via submarine optical cable communications. The optical transmit/receive technology with improved sensitivity enables detection over a long distance of tens of kilometers with a high distance resolution of a few meters. In fact, the distance covered with a single sensing device increases the strength of the technology as the surveillance area broadens. - High environmental robustness:
Analyzing and learning the data collected by the optical fiber sensor using AI enables isolation of environmental noise and identification of event details. This makes it possible that the sensing can be carried out by utilizing existing optical communication infrastructures without newly installing optical fibers for exclusive use in sensing.
3. Introduction of Real World Visualization Examples Challenged by NEC
This section introduces three examples of applications of the optical fiber sensing technology.
3.1 Detection of intrusion around facilities
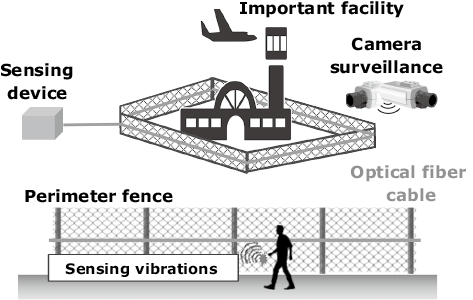
The first example is the detection of illegal intrusion around an important facility (Fig. 2). Since facilities with extensive premises such as airports or power plants require a large number of security cameras to survey the entire perimeter of the premises, a reduction of the surveillance costs becomes a critical need for customers. By simply installing the optical fiber cable along the external fence of the facility, the optical fiber sensor can detect vibrations produced by intrusive behavior. Therefore, it is projected to function as a means of low-cost broad-area surveillance that will supplement the surveillance of cameras. One of the issues that occurs when the sensor is used to detect intrusions is how to reduce the number of false reports. The false report refers to the erroneous detection of vibrations due to non-intrusive behavior such as rain, wind, small animals and so on being defined as an illegal intrusion by a human. This issue can be reduced by AI technology.
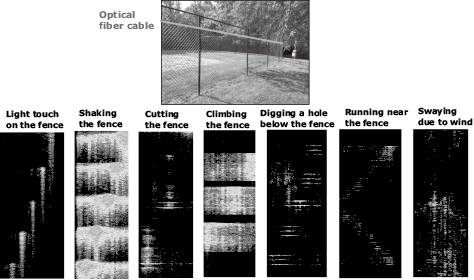
NEC challenges identifying and eliminating the cause of false reporting by combining the sensing technology with superior distance resolution and the analysis/learning technology based on AI. This will make it unnecessary to change the threshold value for solving the issue of false reporting of intrusion surveillance. Fig. 3 shows an approach for visualization of human behavior in the area being surveilled. This system employs an optical fiber cable laid along a fence to sense any human behaviors in their proximity. The patterns of vibrations detected by the optical fiber sensor vary greatly depending on the differences in behaviors made at the fence and the human behaviors near the fence can be estimated by analyzing and learning the vibration patterns using AI.
3.2 Surveillance of road traffic flow
The second case is the surveillance of vehicle traffic flow using the communication-purpose optical fibers already laid in the roadsides1). Fig. 4 shows an example of application to an expressway. Current expressway traffic conditions are monitored by spot surveillance devices such as traffic meters and CCTV (Closed Circuit Television) cameras. Therefore, it involves an issue with the accuracy of information in broad-area situation changes such as traffic accidents and congestions. Noticing the presence of optical fiber infrastructures already installed on the sides of Japanese expressways, NEC has started to challenge traffic flow surveillance of the entire expressway network from a higher viewpoint by continually monitoring the vibrations caused by vehicle traffic via the infrastructures using optical fiber sensing technology. The approach taken by NEC features detailed identification of a situation, even over a long distance by using AI for highly accurate estimations of the traffic traces and average speeds. The traces of vehicle flow are represented by lines with gradients indicating speeds as shown in Fig. 5, where the x-axis is the distance from the control room where the sensing sits and the y-axis is the time. The steep gradients mean congestions and low gradients mean smooth traffic flow. The positivity/negativity of gradients are determined according to the vehicle flow direction with respect to the sensing device.
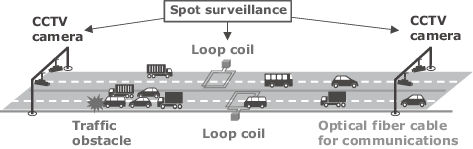
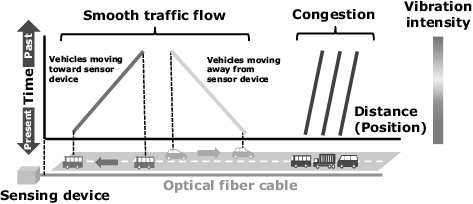
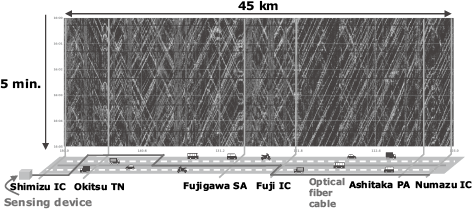
Fig. 6 is the report of a demonstration experiment of traffic flow surveillance conducted jointly with an expressway operator. It shows the result of traffic flow measurements in the 45-kilometer section between the Shimizu and Numazu Interchanges of the Tomei Expressway. The traffic traces are represented by the x-axis indicating the distance and the y-axis the time (5 minutes). The optical fiber cables of Tomei Expressway are laid in various positions, including at the shoulders on both sides as well as at the median, depending on sections, so the observed vehicle driving traces also vary depending on sections. It has been confirmed that the vehicle driving traces are updated at almost real time every 100 ms and that the actual measurements of the traffic flow are recorded on the entire demonstration section over a length of 45 kilometers.
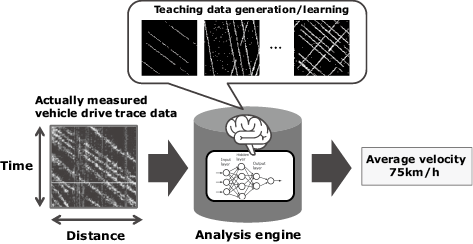
The approach taken by NEC in estimating the average vehicle speed from the drive traces with high accuracy lets the AI learn from the images of the drive traces. Fig. 7 shows the diagram of calculating the average driving vehicle speed. After preparing multiple items of training data of drive trace images represented by the distance and time, the data is learned by the AI to build a highly accurate estimation model. This technique improves the accuracy of calculating the average velocity from the actual drive trace images. It has already been confirmed that the average drive velocity calculated using the optical fiber sensors has a high accuracy of more than 85% compared to the traffic meter (loop coil) data.
3.3 Detection of bridge deterioration
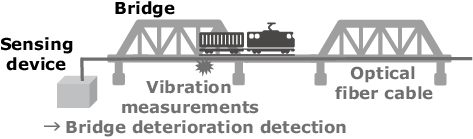
The third case is the detection of bridge deterioration (Fig. 8). NEC is challenging the demonstration of technology that observes the vibrations during the passage of trains via optical fiber cables laid on bridges. It thereby monitors the changes in the vibration characteristics in order to enable automation of the bridge deterioration detection that has previously been checked by human inspections.
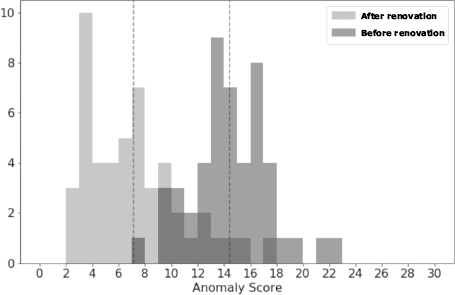
Joined with the cooperation of a train company, NEC has conducted a demonstration experiment that analyzes the vibration characteristics observed by the optical fiber sensor before and after renovation of a bridge in order to check if it is capable of classifying the bridge status. In this experiment, the dampened free vibrations immediately after a train pass is clipped and the specific frequency band observed most strongly on the tested bridge is extracted. The degree of deviation from the model in normal status (after renovation) is output as the anomaly score using the one-class classification (anomaly detection) function of RAPID machine learning. Fig. 9 depicts the distribution of the anomaly scores before and after renovation. The presence of a clear difference between the anomaly scores output before and after the renovation confirms that the bridge status can be classified based on the anomaly scores.
bridge renovation.
4. Conclusion
In the above, an outline and actual examples of applications of the optical fiber sensing technology that NEC is tackling are described. The optical fiber infrastructures that are deployed worldwide like a neural network, are already becoming indispensable for the daily lives of people. NEC will continue R&D for visualizing the real world by continuing to use the existing infrastructures of the optical communications networks as an exploratory sensor.
Reference
- 1) Glenn A. Wellbrock, Tiejun J. Xia, Ming-Fang Huang, Yuheng Chen, Milad Salemi, Yue-Kai Huang, Philip N. Ji, Ezra Ip, and Ting Wang: First Field Trial of Sensing Vehicle Speed, Density, and Road Conditions by Using Fiber Carrying High Speed Data, Optical Fiber Communication Conference 2019, paper Th4C.7, March 2019
Authors’ Profiles
HINO Tomoyuki
Manager
Data Science Research Laboratories
Manager
Data Science Research Laboratories
AONO Yoshiaki
Senior Manager
1st Network Solutions Division
Senior Manager
1st Network Solutions Division
Ming-Fang Huang
Researcher
NEC Laboratories America
Researcher
NEC Laboratories America
TANAKA Toshiaki
Department Manager
Safer City Solutions Division
Department Manager
Safer City Solutions Division
SAKURAI Hitoshi
Senior Expert
Smart Infrastructure Division
Senior Expert
Smart Infrastructure Division