Global Site
Displaying present location in the site.
New Congestion Estimation System Based On the “Crowd Behavior Analysis Technology”
Vol.9, No.1 January 2015, Special Issue on Solutions for Society - Creating a Safer and More Secure SocietyThere is a growing need to address various social issues by applying image recognition technologies in surveillance cameras, thereby contributing to the realization of a safer and more secure society.
In this paper we will introduce a crowd behavior analysis technology that utilizes NEC’s image recognition technology, and as a specific example of its implementation, a new congestion estimation system based on this technology.
1. Introduction
In recent years a growing number of surveillance cameras are being installed in the streets and in public facilities where the people gather, such as public transit terminals and shopping districts, in order to attain a safer and more secure society. Since it is a severe burden to check images from the enormous amount of installed cameras, the need for image analysis technology that automatically detects abnormalities is growing. In particular, there is strong demand for image recognition technology that allows abnormality analysis in crowded environments, such as on crowded city streets and public facilities where there is an increased risk of crime and accidents. How to deal with the increased congestion in cities, especially at game stadiums, associated with the many visitors expected to come see the 2020 Tokyo Olympics from all over the world is of critical societal concern, and there will most likely be a further upsurge in the importance of analyzing technology for crowded environments.
In this paper, we will introduce crowd behavior analysis technology that detects abnormalities in crowded environments, as well as a congestion estimation system that adopts this technology, and examples of this system actually being put to use.
2. Crowd Behavior Analysis Technology
(1) Managing crowds instead of individuals
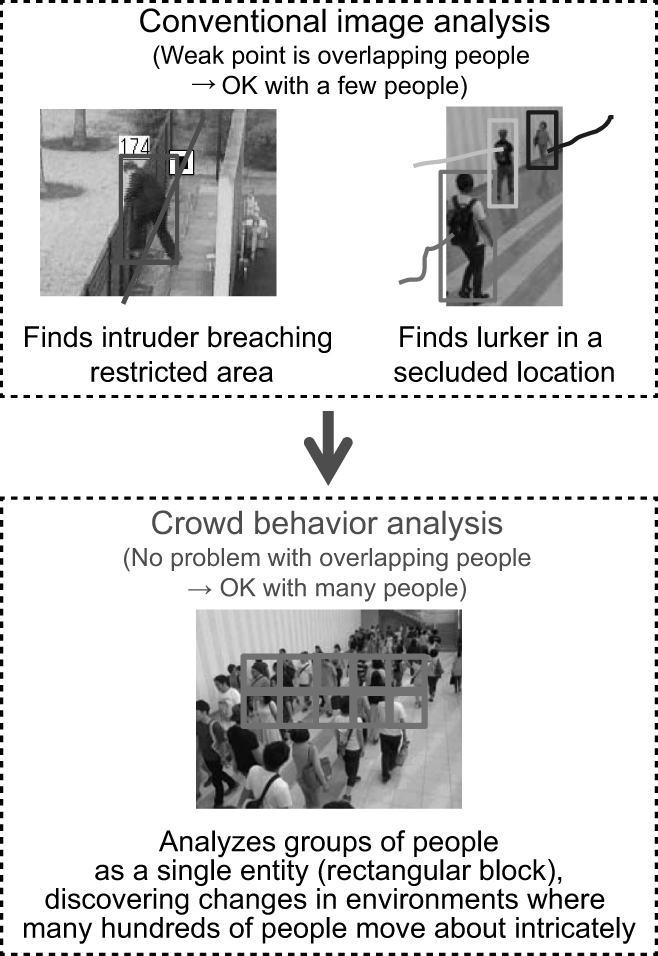
The image recognition technology used in conventional surveillance cameras is based on detecting each person individually and following them. Our new technology differs from the conventional in that it doesn’t detect and follow people individually, but rather as shown in Fig. 1, it handles a group as a single entity instead of a gathering of individuals. For this reason, the screen is divided in a grid pattern and analysis is applied to each grid sector. Since it analyzes clusters of overlapping people as-is, this technology adept at handling masses. As a result, the status of crowds can be comprehended with high precision even in situations that were problematic for conventional technology due to overlaps that hindered analysis, or due to processing being slowed down by having to follow too many subjects.
(2) Analysis of crowd changes
For conventional methods, crowded environments made it difficult for the surveillance camera to see a potential crisis developing. By comparison, as shown in Fig. 2, the effects caused by an abnormality are expected to reach beyond the individual and influence the surrounding groups and masses. For instance, a person falling down will trigger a change in the behavior of people in the immediate vicinity, such as stopping and surrounding the subject.
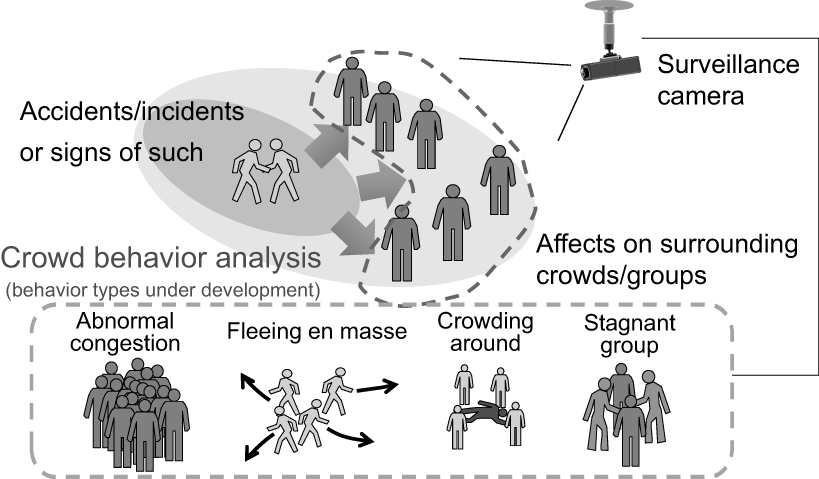
Fig. 2 Abnormality recognition through crowd behavior analysis.
Crowd behavior analysis technology is able to capture these types of changes in crowd and mass behavior by analyzing in cluster units, and detect a potential crisis in a crowded environment. Specifically, the screen is divided into a grid pattern and 2 criteria - population density and people flow - are extracted per sector grid unit as shown in Fig. 1. Based on the extracted criteria of population density and people flow, it is possible to detect behavior such as abnormal congestion, fleeing en masse, crowding around something, and stagnant groups, as shown in Fig. 3. For example, if extremely high population density is maintained for a certain amount of time, the situation will be judged as abnormal congestion. Likewise, if a large flow of people suddenly develops, it is presumably the result of some sort of panic situation where people are fleeing en masse from the scene. If people flow is interrupted in a certain sector and high population density exists there for a certain length of time, we can assume that there is either a group crowding around a person, or a stagnant group of people. These situations may be regarded as potential triggers for the abnormal congestion situations mentioned earlier. As you can see, extracting the population density and amount of people flow makes possible the detection of various changes in crowds and masses.
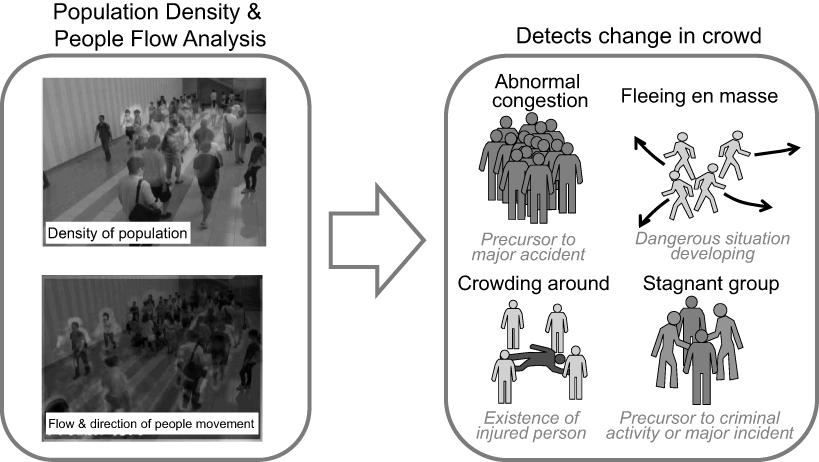
Fig. 3 Crowd change detection through population density and people flow
characteristics.
(3) Comparison/collation using simulated images
In crowd behavior analysis technology, the actual camera image is compared and collated against a simulated image depicting the overlap of people in a congested situation, in order to estimate the degree of congestion in each grid sector. In order to accurately estimate the degree of congestion requires a large amount of sample images of crowds, and there is great difficulty in acquiring such sample images from actual surveillance cameras while giving consideration to the full range of the crowd situations as well as privacy issues. For this reason, our system uses images of people pre-shot looking in various directions and combines them into simulated images as shown in Fig. 4, in order to create reference images depicting a full array of crowded situations. This ensures performance that meets or surpasses that of having to acquire large amounts of samples by hand.
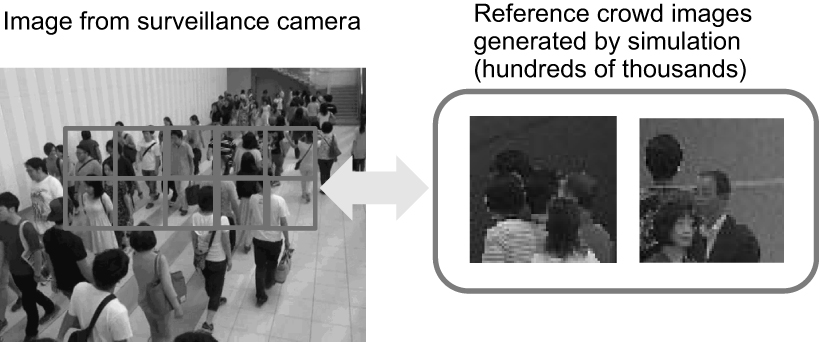
Fig. 4 Crowd detection and number-of-people estimation with crowd patches
generated through simulation.
generated through simulation.
3. Introduction to Congestion Estimation System
As stated in the previous chapter, crowd behavior analysis technology enables accurate estimation of the degree of congestion and flow for each location on the screen. As an example of how this technology is applied, we will be introducing the congestion estimation system.
Fig. 5 depicts the congestion estimation system in its simplest configuration. Video signals are input to the congestion estimation PC via network by using IP cameras.
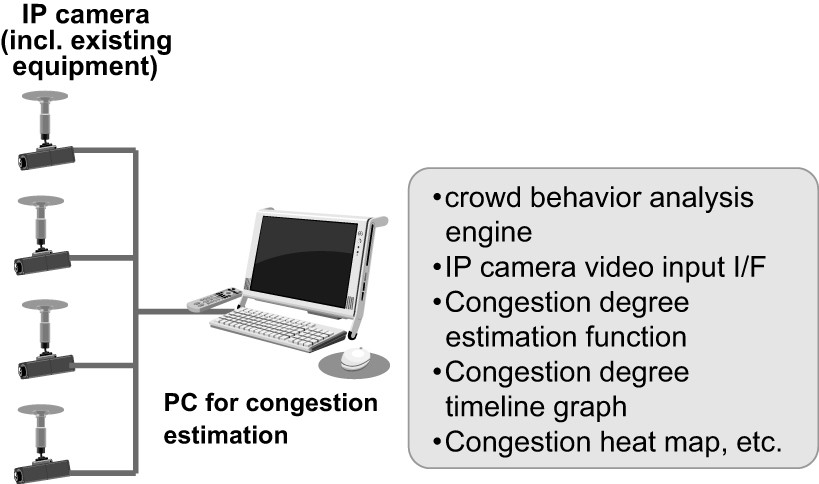
Fig. 5 Congestion estimation system configuration example.
With this system, it is possible to visualize the degree of crowding and direction of crowd movement in real-time for each area, based on the image being shot by the IP camera. It is also possible to display the constantly fluctuating congestion status in graph form (Fig. 6).
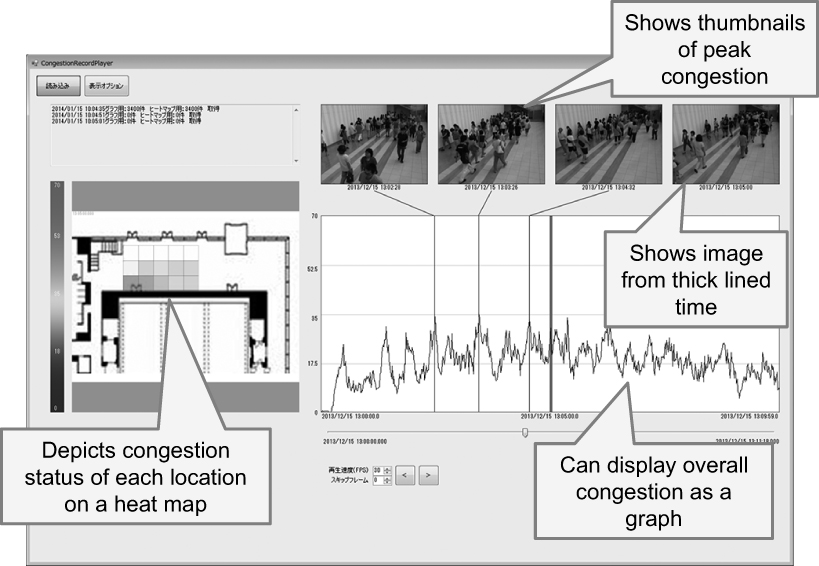
Fig. 6 Congestion estimation system UI image example.
The heat map display shows the estimated degree of congestion with each area color-coded to make it easy to understand which areas are crowded and which are not at a glance.
We presume that there will be cases where our system is incorporated into a surveillance camera system that is already in place. Since, for example, it is possible to analyze crowd conditions by acquiring just 1 frame of video per 1 second from the existing IP camera, a system can be configured at very low cost because installation costs will be minimal and there will be no noticeable increase on network load.
4. Usage Examples by Market
(1) Examples of railroad industry usage
The railroad industry is a good example of a specific usage application.
Fig. 7 is an example of how the congestion estimation system analyzes images received from surveillance cameras installed at train station platforms, and generates a timeline graph depicting fluctuations in the degree of passenger crowding. In this graph, we can see that the number of passengers on the platform continues increasing and getting congested as a repercussion of an accident occurring between 6 and 7AM. Congestion reaches its peak with people nearly overflowing from the platform by slightly after 8AM, but as the trains start running again at 8:15, the overcrowding is quickly relieved.
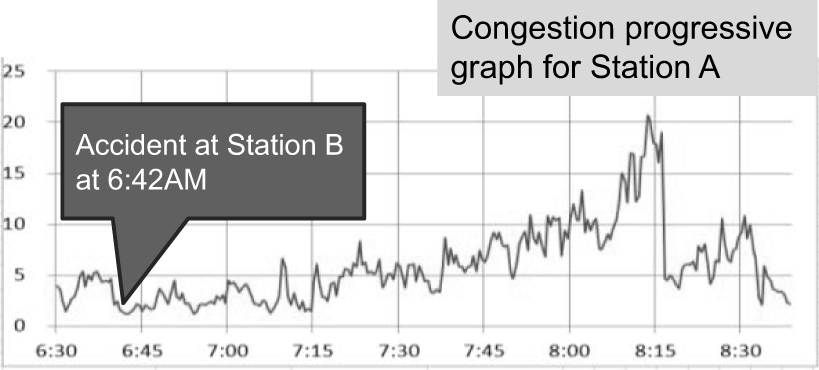
Fig. 7 Congestion progressive graph for station platform (example).
As the congestion estimation system monitors video images from the platforms and concourses, and activates an alarm when abnormal congestion is detected, it will be possible to take appropriate security measures in the station and prevent accidents such as people falling off the platform.
(2) Examples of airport industry usage
Next is an example of how congestion estimation is implemented at an airport security check counter. Passage through these counters is necessary to check for hazardous items in luggage, however when a large number of people converge there, delays in passing through increase. By combining the congestion estimation system with the surveillance cameras at the security check counters, it will become possible to comprehend the degree of congestion at the counters in real time, and the airport operator can better manage the situation by opening more security machine gates, increasing the number of staff or detouring people to other counters. Furthermore, since the degree of congestion can be used to estimate the time it will take to pass through security check, this estimated time can be displayed for airport users to view, enabling them to spend their time until departure more effectively.
(3) Examples of police usage for crowd control
The congestion estimation system, used together with surveillance cameras installed on city streets and intersections, can play an important role in managing the massive flow of people leaving the venue of a large scale event. Using the heat map introduced earlier will show at a glance which intersection or street is crowded right now. Based on this information, it will be possible to dynamically steer the flow of people to less congested streets and effectively disperse and reduce the crowd. Potential panic-causing situations such as people crowding around something or gathering in a stagnant group can be monitored, enabling swift detection of accidents and criminal activity so that police can be dispatched to the scene without delay for the protection and safety of citizens.
5. Forecast of Congestion Conditions
The congestion estimation system allows ever-changing congestion data to be continuously accumulated. By combining data accumulated over a long period of time, with big data analysis technology, it will be possible to understand various characteristics such as the difference between congestion patterns during the morning and evening rush hours, pattern differences by day of the week, and shifts in congestion trends over the span of a year. Based on these characteristics and trends, it will become possible to make forecasts of congestion during specific times of the day, a specific day of the week, or by season. Business operators will be able to plan ahead for effective distribution of personnel and drawing up facility investment plans to reduce congestion.
6. Conclusion
This has been an introduction to crowd behavior analysis technology, and as an example of its specific application, the congestion estimation system. By aggressively pursuing the development of image analysis solutions targeting the growth of safety businesses, NEC will strive to attain a more safe and secure society.
Authors’ Profiles
MIYAZAKI Shinji
Manager
Transportation and City Infrastructure Division
Manager
Transportation and City Infrastructure Division
MIYANO Hiroyoshi
Principal Researcher
Information and Media Processing Laboratories
Principal Researcher
Information and Media Processing Laboratories
IKEDA Hiroo
Assistant Manager
Information and Media Processing Laboratories
Assistant Manager
Information and Media Processing Laboratories
OAMI Ryoma
Principal Researcher
Information and Media Processing Laboratories
Principal Researcher
Information and Media Processing Laboratories