Global Site
Displaying present location in the site.
NEC’s Emotion Analysis Solution Supports Work Style Reform and Health Management
Over the past few years, both the Japanese government and Japanese corporations have been pushing for work style reform with a focus on flexibility and diversity, as well as health management. NEC’s Emotion Analysis Solution reads, quantifies and visualizes a person’s emotional state. This data can then be used to develop an appropriate policy, enabling organizations to implement operating and workplace environments optimized for each employee. In this paper, we describe the system configuration of NEC’s Emotion Analysis Solution and application examples, as well as future prospects.
1. Introduction
Efforts to promote work style reform and health management in Japan have accelerated in recent years as the country’s working-age population continues to plummet due to a declining birthrate and aging population, which has led to a steady decrease in productivity as workers struggle with physical and mental health issues. In response, businesses have begun large-scale implementation of IoT and AI technologies. In tandem with this, extensive efforts are underway to create workplace arrangements that make each employee’s life easier and provide an environment that maximizes each employee’s performance and position assignment that respects individuality (skills, aptitudes, lifestyles, etc.).
To verify the effectiveness of such efforts, questionnaires are typically used. However, it is difficult to conduct questionnaires multiple times over a short span of time and their level of objectivity is not rated highly. Instead, what is required is a means of collecting objective numerical data that can be used to visualize the various emotional states of employees. Visualization and timely response will also make it possible to promote improved health. Evaluations based on numerical data that feature both high objectivity and high temporal resolution ensure that appropriate measures can be taken as and when required.
NEC’s Emotion Analysis Solution — which is the focus of this paper — incorporates emotion analysis technology that can infer an individual’s emotional state based on data obtained from wearable devices. In Section 2, we describe this technology in detail, while in Section 3 we outline a system configuration that achieves excellent real-time performance and data connectivity. In Section 4, we will look at some applications where this technology has already been implemented and speculate on what the future may hold.
2. Emotion Analysis Technology
In the past, the only way to get some idea of the emotional state of customers and employees was to have them fill out questionnaires. While useful for product planning and corporate management, the data collected in this way suffered from a number of problems. It is not really possible to have people respond to the same questionnaire multiple times over a short period of time. They cannot track emotions across time or in precise time units. Moreover, because they depend on the respondent to identify how they are feeling, they cannot be considered objective. For these reasons, extensive research and development efforts have gone into finding ways to visualize emotions using objective numerical data that can be obtained without requiring analysis targets to do anything other than wear the device.
Emotion is a complex state of feeling that produces physiological and psychological responses that can affect thought and behavior. The term “affect” is often used to refer to the behavioral expressions (facial expressions, bodily gestures, speech, etc.) and reactions that accompany the experienced emotion. Thus, by detecting affect from a person’s behavioral expressions and physiological reactions, it is possible to draw an extremely accurate inference of their emotional state.
Data used to infer an individual’s emotional state includes facial expressions1), voice mannerisms2), physiological indices (brainwaves, heartbeats/pulsation, electrodermal activity [perspiration], etc.). Inferring emotions from facial expressions or voice mannerisms is not practical on a continuous basis as the analysis subject needs to be in front of a camera in the case of facial expressions or speaking in the case of voice mannerisms. Physiological indices, on the other hand, can be tracked more or less constantly through the implementation of wearable devices (headset, eyeglass, shirt, and wristband types). The only drawback with this method is that the device has to be worn.
For NEC’s Emotion Analysis Solution, we decided that a wearable device that measured physiological indices offered the most advantages and the fewest drawbacks. Such an approach would be the least burdensome to analysis targets and easily implemented across a broad range of businesses and other organizations. We chose a wristband-type device as this would be the most innocuous and least inconvenient for the wearers and uses time-series data of pulse peak intervals (PPIs, pulse rate = 60 sec./PPI) as a basis for emotion analysis.
2.1 Emotion/affect conceptual model
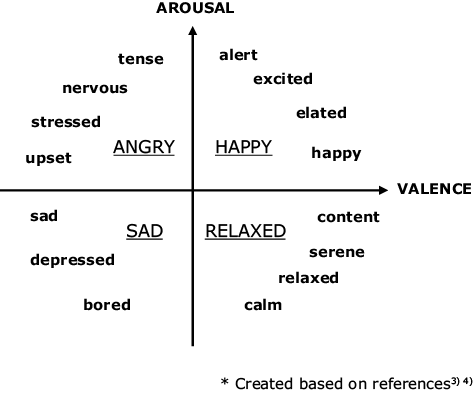
The relationship between various affects such as pleased, excited, tense, distressed, sad, serene, relaxed, and so on has been studied. James A. Russell argued that affect can be expressed in a two-dimensional space by means of two coordinates comprised of arousal and valence (pleasantness/unpleasantness) and proposed a circumplex model in which various affects are placed along the x and y axes3)4). The circumplex model has been used for innumerable studies regarding emotion. Fig. 1 shows Russell’s circumplex model in which various affects are laid out in a two-dimensional space. Our system uses Russell’s circumplex model for templates that express emotions.
2.2 Flow of emotion analysis
The overview of the emotion analysis algorithm is shown in Fig. 2. The time-series data of PPIs is extracted from the data collected by the wearable device. From the PPI data which is output continuously, 256-second data is extracted at 5 second intervals. Feature values are calculated by heart rate variability (HRV) analysis which is described below. By substituting the calculated values with an inference model already established by machine learning, our system calculates the inference values of arousal and valence respectively. After judging in which quadrant the inference values are positioned in Russell’s circumplex model, it presents one of the emotions representative of the four quadrants — happy, angry, sad, and relaxed.
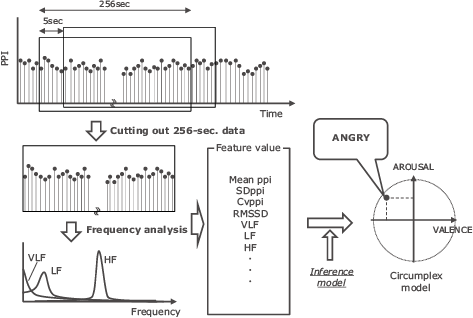
HRV analysis is a time-series data analysis method for heart rate and pulse frequency often used in research and development for inference of internal states such as fatigue, drowsiness, and stress. It is a method that calculates the mean, standard deviation (SD), coefficient variation (CV), root mean square of the successive differences (RMSSD), frequency components (very low-frequency [VLF], low-frequency [LF], high-frequency [HF]), and so on5).
The heart rate constantly varies, being affected by autonomic nerve activity (sympathetic nerve, parasympathetic nerve). This physiological phenomenon is the HRV. For example, when the time-series data of heart rates is put into frequency analysis, LF components affected by both the sympathetic and parasympathetic nerves can be extracted and HF components affected by the parasympathetic nerve can be extracted. And from the ratio between LF and HF (LF/HF), the activity condition of the autonomic nervous functions can be inferred. The autonomic nerve takes action reflecting the conditions of a person. The sympathetic nerve becomes active when they are excited, whereas the parasympathetic nerve becomes active when they are relaxed. Hence, it is considered that the feature value derived from the HRV analysis is effective for the inference of emotion.
Fig. 3 shows the emotion analysis results of a day an employee spent during a business trip. The band graph on top shows the employee’s emotions over time. The band graph in middle shows the numbers of steps and conversations. The employee’s activities are shown on the bottom. Positions where there is no emotion output in the band graph represent periods where data could not be acquired for one reason or another — such as the subject was moving, for example. When the subject was reading and sending email before noon, “angry” was output. When the subject was giving a presentation or riding a bullet train, “happy” was output. When the subject was heading home, “angry” and “sad” were output. When we presented our results to the subject, they said that it made sense because giving a presentation was their favorite task so they would be “happy”, while on their way they were riding a packed commuter train so they wouldn’t feel so good. By crosschecking the emotion analysis results with corresponding activities as shown in Fig. 3, it is possible to take a retrospective look at what emotions an analysis subject was experiencing while carrying out specific tasks.
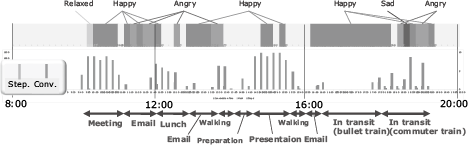
(changes in emotional states over the course of a day).
3. System Configuration of NEC’s Emotion Analysis Solution
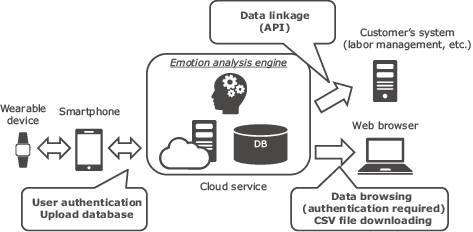
Designed for monitoring employees and facilitating the development of task improvement policies, NEC’s Emotion Analysis Solution is configured to deliver excellent real-time performance and data linkage. The system configuration is shown in Fig. 4. The data acquired by the wearable device is sent to the cloud via a smartphone and then analyzed and processed on the cloud as described in 2-2. Analysis results can be viewed with a web browser and downloaded in CSV format, so you can check the subject’s emotions almost as soon as the subject experiences them. The system also comes with an application programming interface (API) so intersystem linkage is easy. All you need to do is send a data acquisition command from an existing system to the cloud.
Moreover, as this product is offered as a cloud service, no system construction is necessary on the customer side, minimizing the initial introduction cost, and making it easy to scale up or down of the system as required according to the change of the number of customers from trial to full-scale implantation.
3.1 Wearable device
While many devices are available that can collect physiological indices such as pulse rate, only a few are able to acquire the range of indices necessary for emotion analysis. After examining the various devices available, we decided to use the commercially available TDK Silmee W20/W22. In cooperation with TDK, we customized the Silmee W20/W22 and its dedicated app to make it possible to perform emotion analysis. In addition to pulse rate, body surface temperature, and step count, the Silmee W20/W22 can also acquire data — such as how much conversation the user engages in and ultraviolet index (vital data) — that can be utilized not only for emotion analysis, but also for health management and behavioral analysis.
3.2 Cloud system
Data analysis is performed on an emotional analysis engine in the cloud. Incoming data is filtered by user ID and 256-second data chunks are extracted and analyzed. The resulting emotion analysis data is stored in a database together with vital data. Results of the analysis can be viewed on a web portal screen called the emotion visualization dashboard. A CSV version of the results can be downloaded via the portal screen.
4. Application Cases and Future Prospect
Since first introduced in June 2018, NEC’s Emotion Analysis Solution has been implemented in various industries and businesses, including transportation, manufacturing, construction, and healthcare/nursing, on both a trial basis and full-scale operation.
We asked the line workers of NEC-affiliated factories to put on the wearable device and analyzed their emotions in various tasks and processes. As a result, we were able to determine which processes were associated with higher stress (lower in valence). Once these processes have been identified, improvements can be made to promote a more comfortable working environment.
Most industries are now aware that by cross-referencing emotions and task records they can obtain data useful for improving task processes and assigning tasks appropriately. Using this data makes it possible to determine which tasks impose a high psychological burden, to optimize each task, and to allocate compatible members in multi-member tasks.
We are also examining the potential for deploying this system in applications other than work style reform and health management. For example, when we asked the audience at an in-house event (lecture) to wear the wearable device so that we could analyze the changes in emotions they felt during the lecture, we were able to obtain emotional fluctuation data that correlated with the content of the lecture. We think this makes it possible to use NEC’s Emotion Analysis Solution to monitor the emotional reactions of attendees at lectures and training sessions, and to provide data that can be used to help improve the lecturer’s presentation techniques.
So far, most of the correlation analysis we have done has applied to task records and emotions, in order to extract issues pertaining to tasks. Emotions, on the other hand, are affected by many other factors, including daily accumulation of fatigue, lifestyle, temperature, and humidity, in addition to the content of the task involved. Going forward, we will be focusing on identifying issues that have gone unnoticed and proposing concrete plans for improvement by leveraging our AI technology to perform emotion analysis using continuously acquired emotion data, vital data, detailed task record data, and environmental data.
5. Conclusion
NEC’s Emotion Analysis Solution is a cloud-based system based on our proven AI technology that provides a low-profile, effective means of analyzing people’s responses to situations and inferring their feelings based on the behavioral and physiological reactions they demonstrate. This system allows companies to discreetly monitor the mental and physical states of their employees, thereby providing appropriate support and improving the way tasks are structured and assigned. As we continue to advance this technology and refine our system, we expect to provide ever more sophisticated services to support work style reform and health management, reflecting our commitment to helping achieve a safe and more secure society.
- *Silmee W20 and Silmee W22 are trademarks of TDK Corporation.
- *All other company and product names that appear in this paper are trademarks and/or registered trademarks of their respective owners.
References
- 1)
- 2)
- 3)James A. Russell: A Circumplex Model of Affect, Journal of Personality and Social Psychology, Vol.39, pp.1161-1178, 1980
- 4)JONATHAN POSNER, JAMES A. RUSSELL, BRADLEY S. PETERSON: The circumplex model of affect: An integrative approach to affective neuroscience, cognitive development, and psychopathology, Development and Psychopathology, Vol.17, pp.715-734, 2005
- 5)
 Microsoft Face API
Authors’ Profiles
ABE Katsumi
Assistant Manager
Smart Industry Division
Assistant Manager
Smart Industry Division
IWATA Shinichiro
Senior Expert
Smart Industry Division
Senior Expert
Smart Industry Division