
Global Site
Displaying present location in the site.
MasterScope Network Manager - Technical Details
Feature Outline
Basic features
Optional features
Appendix
Basic Features
Configuration Management
Network Manager provides a function that displays configuration maps for the visual management of IPv4/IPv6 networks, a topology management function that displays the wiring conditions of network devices, and a function that graphically displays the path between any two points in the network.
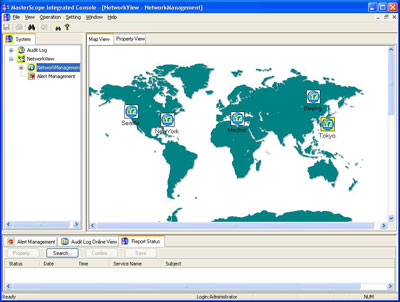
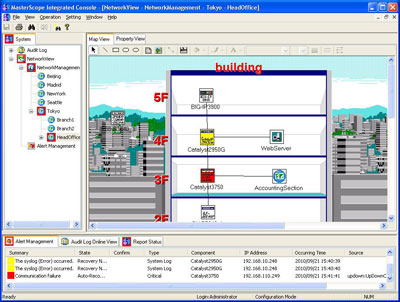
Graphical Display of Network Configuration
Network devices are automatically detected and a network configuration map is created. Floors and networks are displayed as easy-to-understand icons on the map, and the arrangement of these icons is fully customizable. The bitmap in the background, too, is fully customizable.
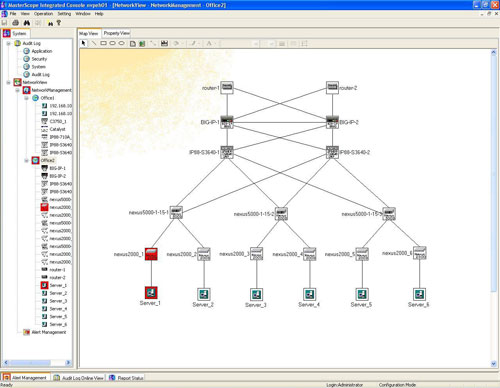
Physical Topology Management Function
This function collects information about the device connections on the network and automatically maps it. Information can also be manually registered. When used, the complicated wiring of network devices can be grasped in one glance.
Network Manager supports failure detection on devices from a variety of vendors, including the Nexus5000/2000, currently garnering attention as a next generation data center switches. Through the intuitive display, it is accelerated to address where the failure occurred and minimize the work load for IT administrators.
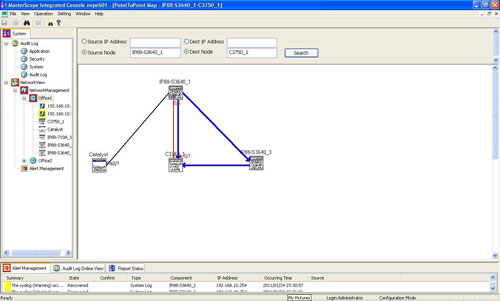
Point to Point Map Function
Graphically displays the path between any two points on the network, such as a path from the client to the server. Moreover, it is easy to confirm failure information from that path (such as link failures and high loads) on a single screen, Network Manager can be used to quickly identify the source for communication failures.
Managing Device Information Lists
Currently registered network configuration information (such as IP address, SNMP community name, and SW version) can be exported as an external CSV file. This makes it possible to manage assets as a list of device information.
Importing configuration information is also supported and can be used in large-scale environments with numerous devices registered.
Front Panel View (NodeManager)
Understanding the status of ports is simple using a front panel that looks like an actual device.
Panel Window Display
The front panel displays a realistic panel window that looks as if the actual device is there right before your eyes even while monitoring from a remote location.
Management items for particular devices can also be added.
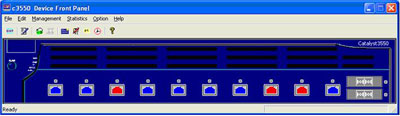
Cisco Catalyst 3550-12T
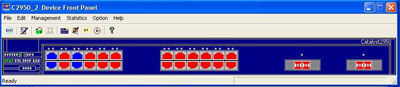
Cisco Catalyst 2950G-24
Detailed Management of Device Information
Displaying Device Information
Device memory, temperature, power, fan, and related information belonging to specific devices can be referred to in detail.
Displaying Configuration Information
All types of configuration information from nodes including interface name, type, speed, and operational status are directly acquired and displayed.
Displaying Statistics
Statistical information from nodes can be displayed in the various kinds of formats (snapshot, table, line graph, and bar graph). In addition to collision counts and FCS error counts, protocol information such as IP/UDP/TCP reception, transmission and error information can be displayed in tables and graphs. RIP UPDATE transmission counts, OSPF LSA generation counts, and other routing information can also be displayed.
Per Device Command Execution
Execution of predefined command lines on network devices can be executed in accordance with defined schedule.
Failure Management
Network Manager can detect failures and notify them to the administrator quickly by various monitoring components, including ICMP, SNMP traps, MIBs, and more.
Failure Detection and Notification
A variety of network failures can be detected through:
- Alive status monitoring of devices (determined by no ICMP reply)
- SNMP trap monitoring (vendor-defined traps may also be monitored)
- SYSLOG monitoring
- Switch/router interface up/down
- Abnormal network traffic
- MIB threshold checks
- Host resource (CPU, physical memory, disk usage) monitoring
Detected failures are notified through the following processes.
- The color of the map icon will be changed
If a failure is detected, the color of the corresponding icon changes so that the user can identify the location of errors at a glance on the screen. - Display a list of alerts
Even complex network system, the problem spot can be rapidly identified with a function jumping to the device icon that generated the failures.
Alert Notification
Network Manager can report specific alerts at the time they are generated. Failures are detected immediately and notified to the administrator.
- Email notification
- Alarm light notification
Click here for more information on the supported alarm lights. - Action notification
- Execute commands
Any programs such as bat, cmd and exe can be executed. - Trap forwarding
Alerts detected by Network Manager can be forwarded to the management system as SNMP traps
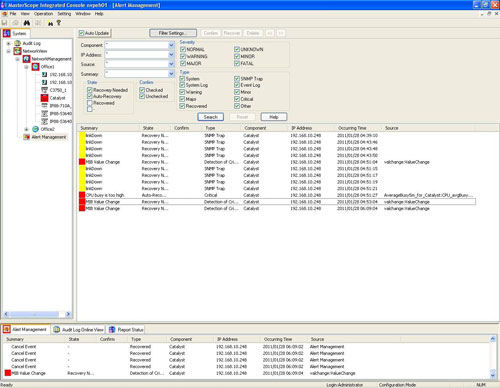
Current Alerts
Only the unresolved alert information that must be checked and investigated is displayed, and once resolved, the alert information is automatically deleted. Since only the current alerts are notified on-screen, you are protected against overlooking important failures.
Alert Aggregation
Aggregating alert information enables easy analysis of failure when you get many alerts.
Scheduling Feature
You can define the schedule to start and stop the monitoring operation per device icons or maps, for example during network construction. Monitoring of certain networks can also be started or stopped manually by just one click. Locations where monitoring has been stopped will change the icon color so as to be readily identifiable. You can also change notification rules according to operation schedule, for example different notification destination on weekends.
SYSLOG Monitoring
You can receive and manage centrally the system log (SYSLOG) centrally, which indicates the detailed status and failure information of devices. Any SYSLOG conforming to RFC3164 (The BSD syslog Protocol) can be received and reported in the alert lists.
Performance Monitoring
In Network Manager, performance information is accumulated through its periodic collection from a management information base (MIB) by equipment that supports SNMP. The collected information can be used for real time analysis and the creation of performance reports.
The collected data is automatically saved in the CSV (Comma Separated Value) format.
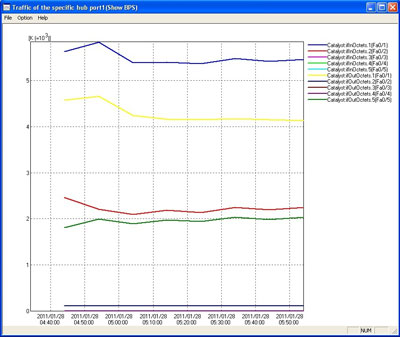
Real Time Analysis
Enables to check the current changing network situation. Compared to the normal traffic performance, you can prevent network failures at an early stage.
Example of traffic on a particular port of a hub
Creates the report in order to check whether the volume of input and output data of a specified port on a specified hub is optimal as well as the trend of the data volume.
Creating Performance Reports
Reports can be created based on the accumulated statistics daily/weekly/monthly/yearly. With this report, you can understand the long term trends of the statistical data. Reports can be created for a variety of data, including the traffic of specific nodes, CPU performance, traffic on a specific port on a hub, WAN traffic, and server loads.
Example of traffic on a specific node (unit: day)
Network Manager supports when you need to analyze traffic volume accoding to changes in your business operation.
The data can be used for checking whether processing capacity is adequate, how concentrated the load is and data volume trends etc when you newly implement Web application, add servers, which leads to increase traffic volume, review the contract details for the WAN between offices and so on.
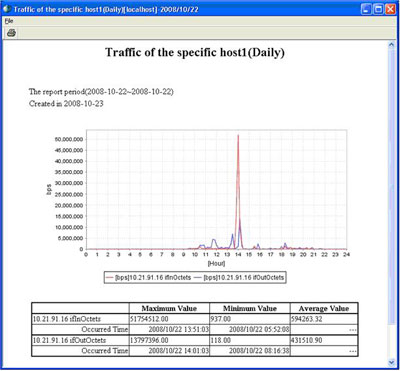
By simply setting the device and port number in a template, reports are automatically generated daily, weekly, monthly, or yearly.
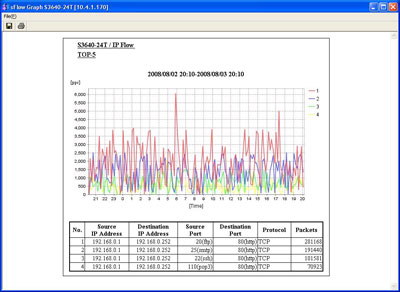
Creating Reports from Network Flow Information
A detailed network usage report is automatically created from traffic flow information (sFlow Ver4/5) as monitored from the switch and router. The report based on the sFlow information is created daily. Traffic trends and individual End-to-End application traffic conditions can be analyzed.
Example of IP flow display
Individual IP addresses with high-volume flows of data traffic (packet count) are displayed. Conditions specified in advance in the sFlow graph display dialog are shown, making it possible to view flows with more packet statistics and investigate the flows with the highest traffic.
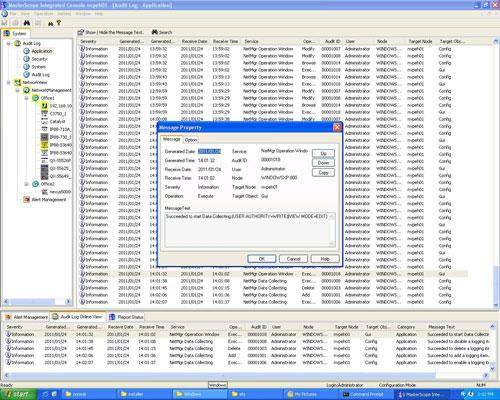
Audit Logs Management
Recording the details of operations, including “when,” “who,” and “what was operated,” is a critical point to strengthen the internal controls of an organization. MasterScope Network Manager performs trail management regarding network operations management by automatically recording the content, result and history of actions and automatically executed processes in an audit log.
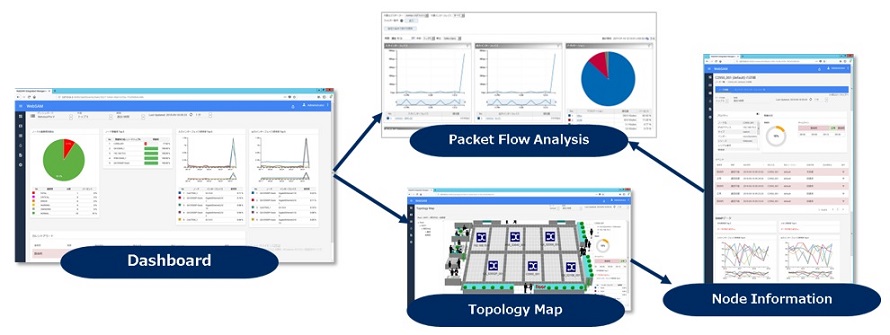
Web Console
The web console provides a dashboard, topology map, and packet flow analysis view to analyze a cause of network problem.
Optional Features
Managing Configuration Files and Software (ResourceManager)
ResourceManager achieves new levels of maintenance efficiency and shortens work times through the management of configuration files and software on multi-vendor network devices.
In case of backing up configuration files for 50 network devices for example, work time will be reduced to approximately 1/4 of the time it once took. If you need to upgrade software (firmware) for the same number of devices, time will be reduced to approximately 1/16 of the time it took before using ResourceManager.
(*The above times will vary depending on the number of network devices and configurations)
Configuration File Management
ResourceManager effectively manages configuration files of devices on multi-vendor networks.
Batch backup of configuration files on multiple devices
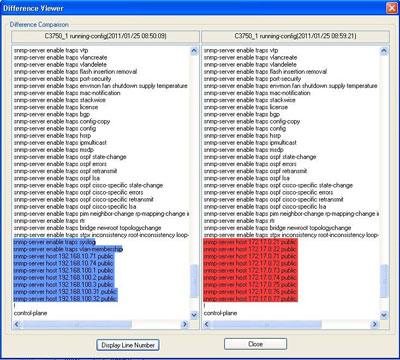
The configuration files of your multi-vendor network devices can all be backed up all at once. Generation management is performed for the backed up configuration files. Moreover, you can easily identify the changes through a function that displays differences in configuration files.

Batch updating of configuration files
Configuration files on your multi-vendor networks can all be updated all at once using the same procedure. A history of file updates is recorded.
Monitoring tampering of configuration files
Unauthorized overwriting of configuration files can be detected through the monitoring of network devices at regular intervals. You will be notified with an alert if a change to a configuration file is detected.
Software (Firmware) Management
Software on multi-vendor network devices can all be updated at once. Software (firmware) can be installed easily, even without knowing the different procedures that apply to each device software (firmware). Work time is reduced as software is installed on all the multiple devices at once. After installation, the devices must be restarted so that the new settings can take effect, and this can also be specified and executed on a schedule.
Appendix
Network products special order items (These products are linked with MasterScope Network Manager Failures Detection and Notification Feature)
| Types | Special order number | Specifications |
|---|---|---|
| NHE-3FB-RYG | T0114 |
Firmware English letters
|
| NHM-3FB-RYG | T0114 |
Firmware English letters
|
| PHC-100A | FT003 |
|
| PHE-3FBE1-RYG | FT008 |
NO AC adapter
|
| PHE-3FBE1-RYG | FT007 |
|
Also see PATLITE Corporation global website here:  https://www.patlite.com/