
Global Site
Displaying present location in the site.
MasterScope Invariant Analyzer - Key Features and Functions
Key Features
Simplified Performance Analysis
Automatically analyzes system performance data collected by monitoring tools throughout the system. Enables management of large-scale systems efficiently without detailed understanding of whole system or complicated configurations.
Automated Silent Failure Detection
Leveraging NEC’s unique model-based failure detection technique, accurately detects and diagnoses system failures that have been conventionally undetectable, before they become critical problems and affect business operations.
Failure Location Visualization
MasterScope Invariant Analyzer leverages NEC's unique technology to automatically detect failures and localize their root causes even in large-scale systems, resuting in proactive troubleshooting before Silent Failures become actual critical problems.
Accelerated Troubleshooting
Actions taken in response to each failure can be recorded for future reference. In the future, prompt action can be taken for similar failures by simply referencing to these records.
Functions
Initial Screen
Simple and easy to understand display of analysis results all in one screen.
Automated Invariants Analysis
After extracting and modeling constant relationships (i.e. invariants) among performance data collected during normal system state, Invariant Analyzer tracks broken invariants in operational stage to automatically detect abnormal system behavior as anomalies. (NEC’s patent).
- Automatic analysis enables easier management by eliminating need for specific understanding of the system or complicated settings.
- As it focuses on constant relationships among the collected data, it is unnecessary to modify thresholds frequently to conform to changing business conditions.
- Command-line interface to analyze data is also available.
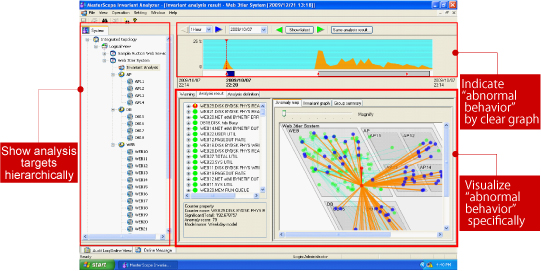
Root Causes Visualization
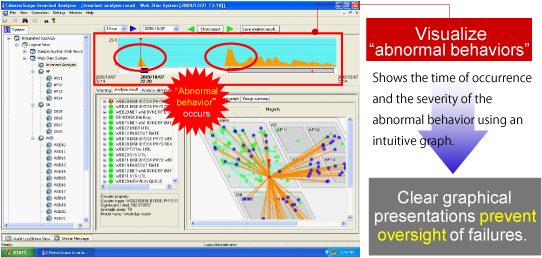
Visualizes Failure Graphically
Clear graphical presentation prevents oversight of failure.
- Shows the time of occurrence and severity of abnormal behavior using an intuitive graph.
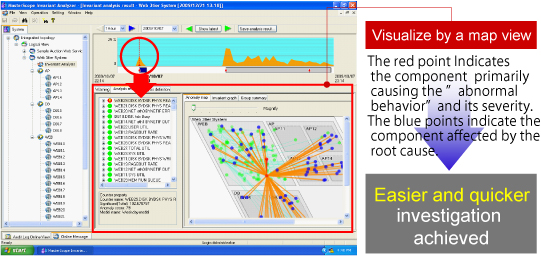
Identify Failure using Map Views
Intuitive map view helps administrators analyze the failure easily and quickly.
- Extract and visualize the specific component primarily causing "abnormal behavior".
- The impact of such behavior can also be discerned at a glance.
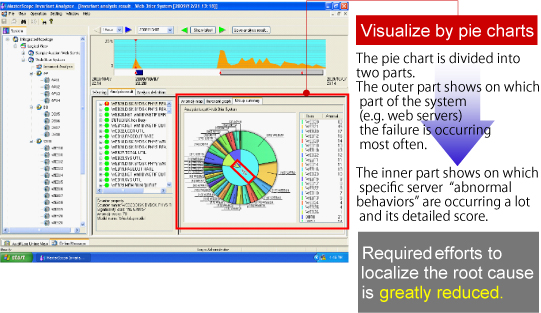
Visualize Failure Location using Pie Charts
Pie charts help administrators determine the failure’s root cause from the statistical point of view.
- Identify which part of the system is most likely to fail.
Knowledge Base
Actions taken in response to each failure can be recorded in knowledge base for future reference.
- Subsequent failures can be quickly resolved by referencing previous actions taken for similar abnormal behavior.