
Global Site
Displaying present location in the site.
MasterScope SystemManager G - Version Information
Key Feature Enhancement
8 Key Feature Enhancements (released on Jul. 18, 2018)NEW
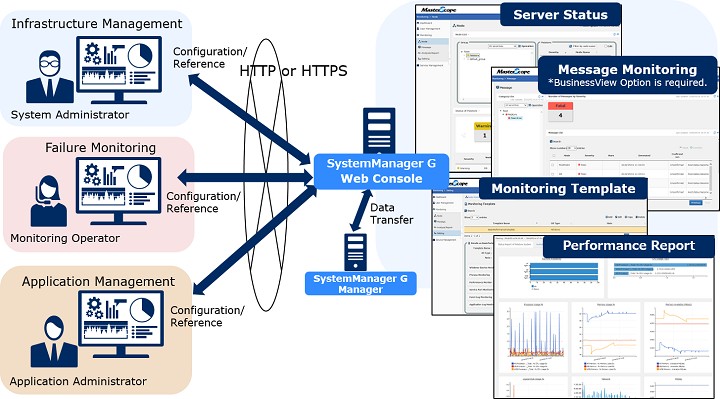
Web Console Feature [Web Console Option]
Web browser console allows you to monitor systems and check performance reports on user-customizable dashboards from anywhere.
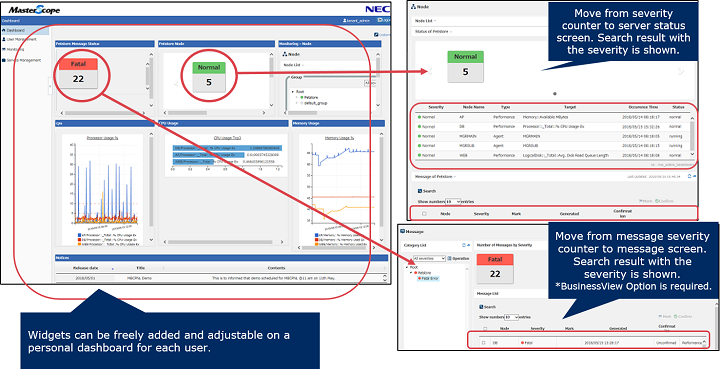
Monitoring Dashboard [Web Console Option]
You can create and customize your own dashboard with widgets to get a quick view of the system status as soon as you login.
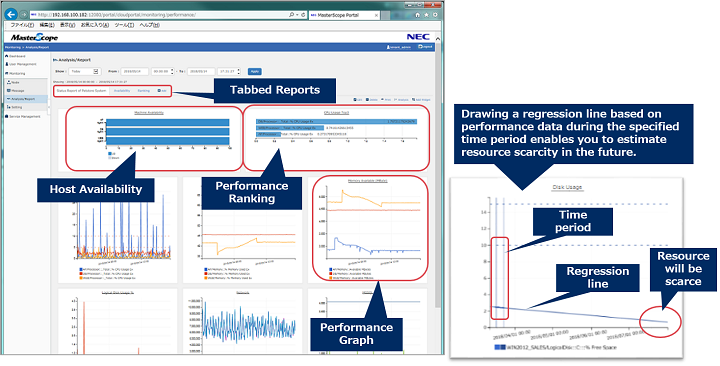
Performance Report [Web Console Option]
Collected performance data is dispayed as human-readable reports such as performance graphs, host availability, and rankings. Graphs can be shown with regression lines utilized for capacity management.
7.1 Key Feature Enhancements (released on Aug. 31, 2017)
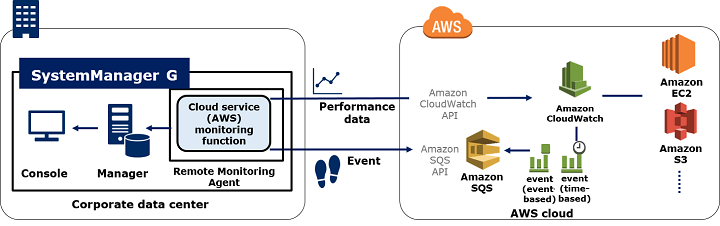
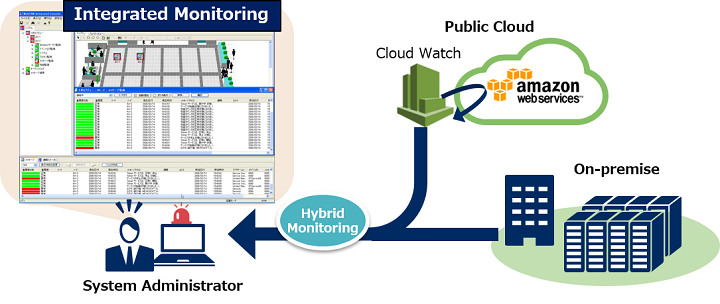
Cloud Service (AWS) Monitoring Function [Cloud Monitor Option]
Infomation is collected via API provided by public cloud service (Amazon Web Service) to provide the following features.
-
Performance Monitoring
Amazon CloudWatch functions are used to monitor the operations and performance metrics of the resources in AWS. - Cloud Event Monitoring
Amazon CloudWatch is used to monitor resource status changes. EC status change events are atuomatically added to the rules for sending messages to SQS and event information is obtained from the SQS queue.
Benefits
Integrated monitoring of on-premise and public environments on a single screen enables effective and efficient system operation.
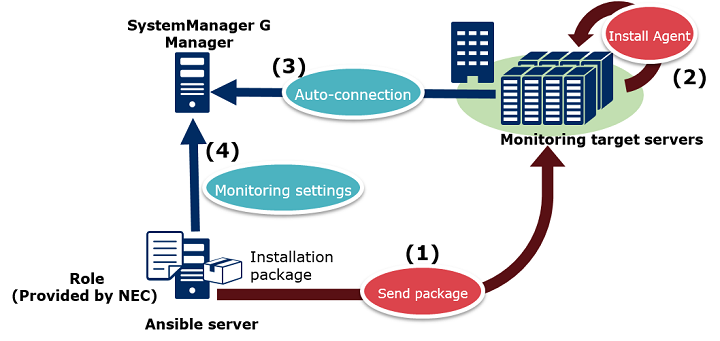
Simplified Implementation of Agents
Ansible roles are provided to automate the installation and setup of an agent remotely by a playbook, reducing operational errors and costs.
Customizable Performance Monitoring [Customizable Performance Monitoring Option]
The numerical data results of arbitrary commands and programs are stored as performance data and used for threshold monitoring, graphs, and reports.
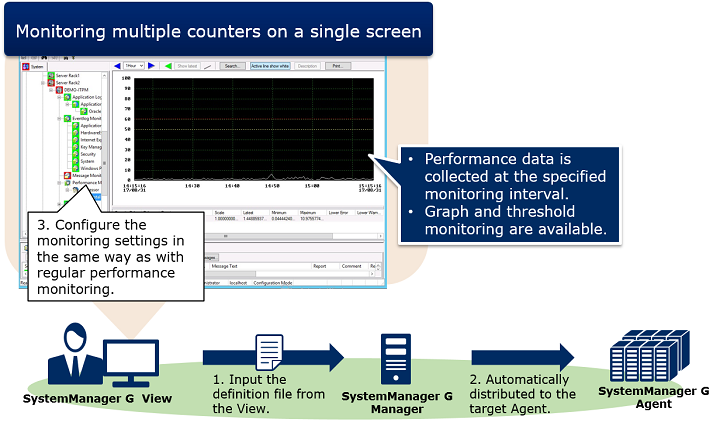
Benefits
A customer wants to monitor servers that require different methods of getting performance information together.
⇒ Customizable performance monitoring enables integrated monitoring by monitoring the existing command results.
A customer wants to create graphs and reports using the existing system to count the number of accesses.
⇒ Customizable performance monitoring realizes the requirement by monitoring the number of the accesses.