
Global Site
Displaying present location in the site.
MasterScope Network Flow Analyzer - Technical Details
Feature Outline
Features
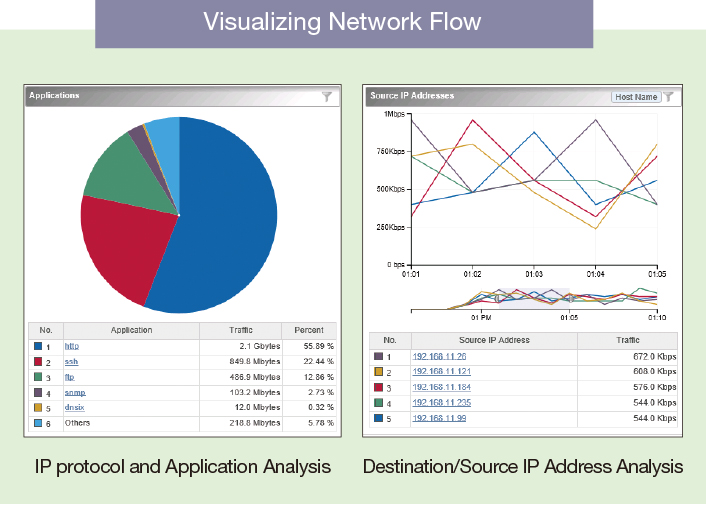
Visualizing Network Flow
The breakdown of traffic is visualized by gathering the flow information of NetFlow/sFlow, it enables administrators to analyze the network load easily.
Dashboard
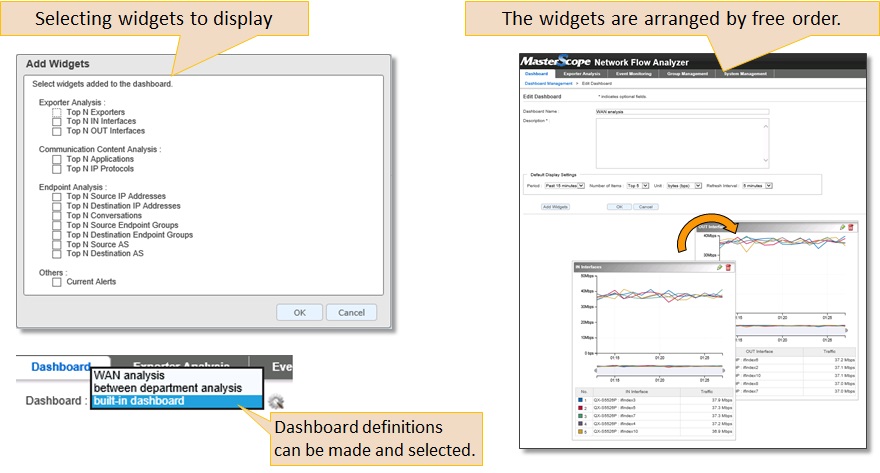
Customizable Dashboard
Graphs and current alert lists can be selected and placed freely to suit the purpose. Displaying only the necessary information helps efficient analysis. You can make dashboard definitions according to each purpose and easily switch between them.
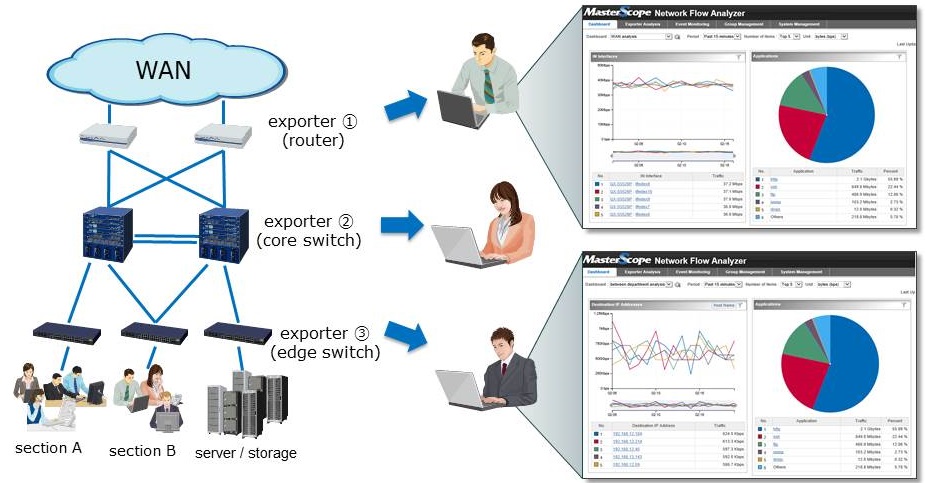
Dashboard for each user
Each user can customize a dashboard according to the respective work.
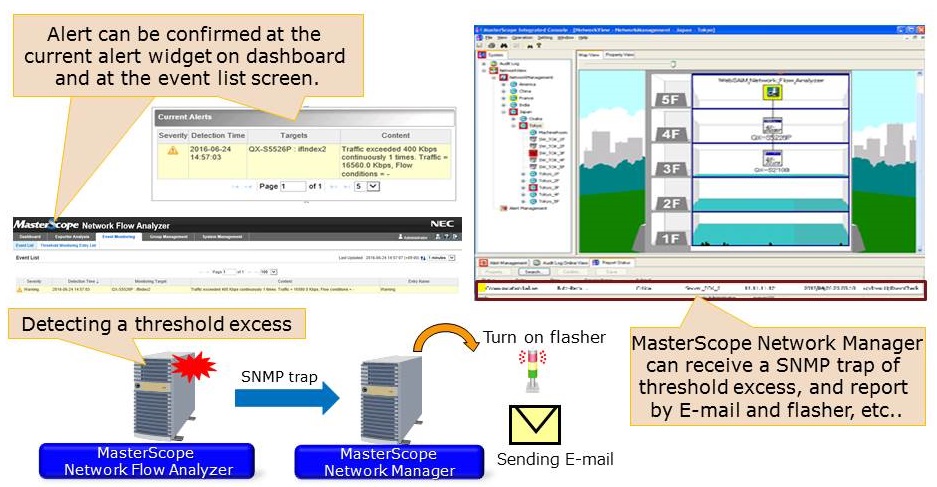
Threshold Monitoring
Before serious failures occur, threshold monitoring can detect performance degradation. Following flow data can be monitored : “Application”, “IP Protocol”, “Destination/Source IP address”, “Destination/Source AS”.
Threshold excess alerts can be sent not only to the current alerts widget of the dash board, or event list screen, but also to other systems such as the MasterScope Network Manager, etc in SNMP trap format.
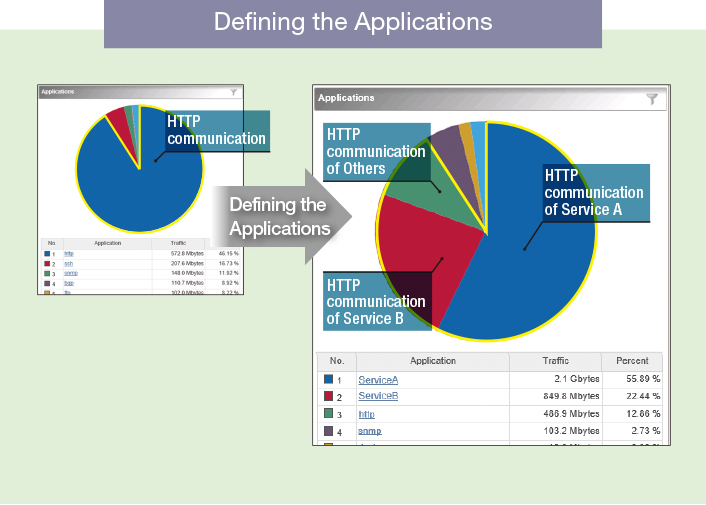
Defining the Applications
By defining applications by the combinations of destination/source IP address and port number, detailed analysis can be made of applications that cannot be distinguished by only the port number.
Grouping Definition
Grouping Endpoint
With defining groups using endpoint IP address, the traffic information can be displayed by units like location or department. This function enables unit-by-unit analysis of detailed data, such as external traffic volume and breakdown among applications used.
Grouping Interface
By defining groups using several interfaces of exporters, you can carry out application breakdown analysis for a logical interface that is aggregated together by Link Aggregation (LAG), similar to that for physical interfaces.