Global Site
Breadcrumb navigation
Guidelines and Best Practices for Developing Dashboards
NEC Security BlogJul 5, 2024
SIEM (Security Information and Event Management) is often used in many situations for cybersecurity monitoring to efficiently analyze data collected from various sensors. Additionally, in the analysis of security incidents, a log analysis platform is used to analyze logs from multiple devices. Dashboards are commonly utilized in these situations. By visualizing analysis contents in a dashboard in advance, analysts can easily access the information they need, which leads to enhanced analysis efficiency and improved analysis quality.
On May 31, 2024, the Digital Agency, Government of Japan released the "Dashboard Design Practice Guidebook and Chart Component Library (Beta)" (referred to as the “Practical Guidebook”).![]() [1] This document aims to enable efficient development of simple dashboards by systematizing the process and development. While the guidebook is intended for use with the business analysis tool "Power BI
[1] This document aims to enable efficient development of simple dashboards by systematizing the process and development. While the guidebook is intended for use with the business analysis tool "Power BI ![]() [2]," many of the ideas outlined in it can also be applied to the development of dashboards for cybersecurity monitoring and security incident situations.
[2]," many of the ideas outlined in it can also be applied to the development of dashboards for cybersecurity monitoring and security incident situations.
In this blog, I would like to introduce the Practical Guidebook as well as additional resources to supplement it.
Table of Contents
Development Process Advocated by the Practical Guidebook
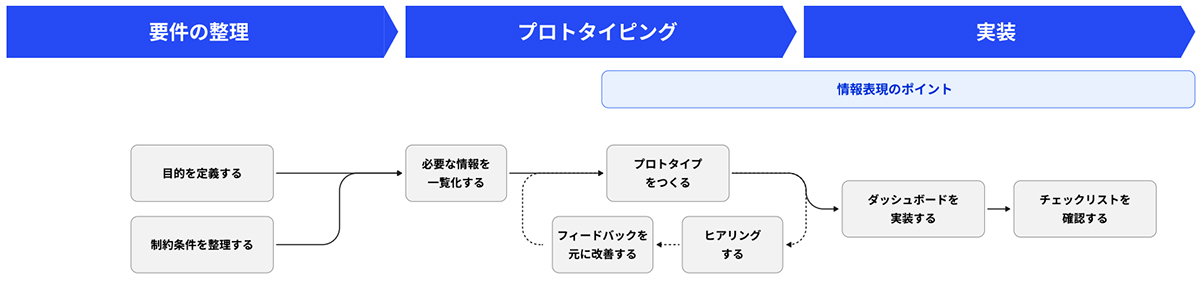
The Practical Guidebook divides the dashboard development process into three stages.
-
Requirements Definition
-
Prototyping
-
Implementation
 Larger view
In the requirements definition step, the 5W1H framework is used for organizing the information. By using this framework, it defines the radical purpose of the dashboard. Also, it helps to clarify what information to provide for viewers and what actions they should take after viewing the dashboard. The "Requirements Definition Worksheet" that can be used for organizing those ideas will be very helpful for considering the story to tell the viewers of the dashboard. In particular, the “purpose of viewing” which is organized by "What, so What" is also an important factor in considering what kind of information needs to be displayed on the dashboard.
In the prototyping step, in order to achieve the content organized in the requirements definition, a cycle of data organization, prototype creation, and feedback gathering is used. With the term “prototype,” many people will think of creating something that actually works and making minor modifications based on feedback. Regarding prototypes advocated in practical guidebooks, terms such as “wireframe” and “mock-up” are easier to convey the intention. Based on the results of data organization, the layout of the framework (wireframe) is examined, the visualization items such as charts, graphs, and diagrams are arranged and colored according to the framework (mock-up), and then feedback is reflected to reconcile the images. This can be done by using tools such as PowerPoint or other office software, which allow for quick and easy creation and modification. By following this, it can help reduce the risk of costly rework later.
In the implementation step, by using the pre-defined parts of Power BI envisioned in the Practical Guidebook, it is possible to proceed with development with a unified design (Chart component library). When using a dashboard development platform other than Power BI, having the parts of unified design and setting would enable a consistent development style. Additionally, it provides a "checklist" to recheck whether the requirements identified in the requirement definition have been adequately implemented (This checklist is available in “5.4 Checklist” in the Practical Guidebook, or in the “Related Materials of the Practical Guidebook” in ![]() [1]). This checklist covers many aspects of design and content that are necessary for any dashboard development platform, so it will be useful for finalizing the dashboards.
[1]). This checklist covers many aspects of design and content that are necessary for any dashboard development platform, so it will be useful for finalizing the dashboards.
Utilizing the Practical Guidebook in Dashboard Development Platform
The Practical Guidebook is designed for Power BI, so in the case of other dashboard development platforms, it needs to be adjusted to its platform. In this section, I will introduce the materials provided by the business intelligence tool "Domo" to reinforce the Practical Guidebook. Also, I would like to share my idea of using the Practical Guidebook in Splunk Enterprise, where I have experience in dashboard development.
The Dashboard Development Process
The same concept can be applied to the overall flow of the development process regardless of the dashboard development platform. In Splunk, a presentation on the best practice of dashboard development "Dashboard Design and Best Practices" was also released ![]() [3]. This presentation also starts by clearly defining the goals and what kind of viewers and purpose the dashboard will be provided. Also, the contents were arranged in a notebook based on what has been considered and the composition of the panels was thought out. This approach is similar to the method introduced in the “prototyping.”
[3]. This presentation also starts by clearly defining the goals and what kind of viewers and purpose the dashboard will be provided. Also, the contents were arranged in a notebook based on what has been considered and the composition of the panels was thought out. This approach is similar to the method introduced in the “prototyping.”
Requirements Definition
The "Requirement Definition Worksheet" provided by the Practical Guidebook can be used to organize dashboard requirements in layers that are not affected by the dashboard development platform. When developing dashboards with Splunk Enterprise, using a worksheet at the beginning to clarify the requirements in terms of 5W1H will be helpful for later prototyping and implementation steps.
Prototyping
The following process will involve considerations specific to each dashboard development platform.
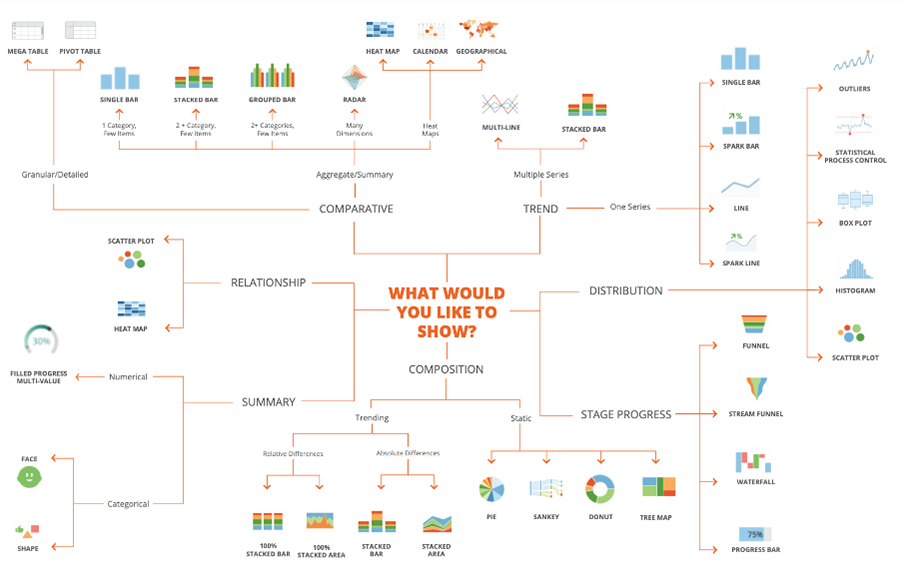
In the data organization section in the Practical Guidebook, what kind of data is used and what visualization items are used are considered. While the Practical Guidebook provides ideas for choosing visualization items, the “Diagram of graph type” which is provided in the “Best Practices for Choosing Chart Types![]() [4]” in Domo, can be a powerful tool for selecting visualization items.
[4]” in Domo, can be a powerful tool for selecting visualization items.
 Larger view
For examining the layout as a framework using PowerPoint (wireframe), the same method as the Practical Guidebook can be followed. On the other hand, when creating a mock-up, the appearance of the visualization items that can be used in the dashboard development platform may differ from Power BI, there will be a deviation from the image during implementation if it is used as it is. Splunk Enterprise comes with the Examples Hub ![]() [5], a catalog of visualization items and dashboard examples that can be used within the system.
[5], a catalog of visualization items and dashboard examples that can be used within the system.
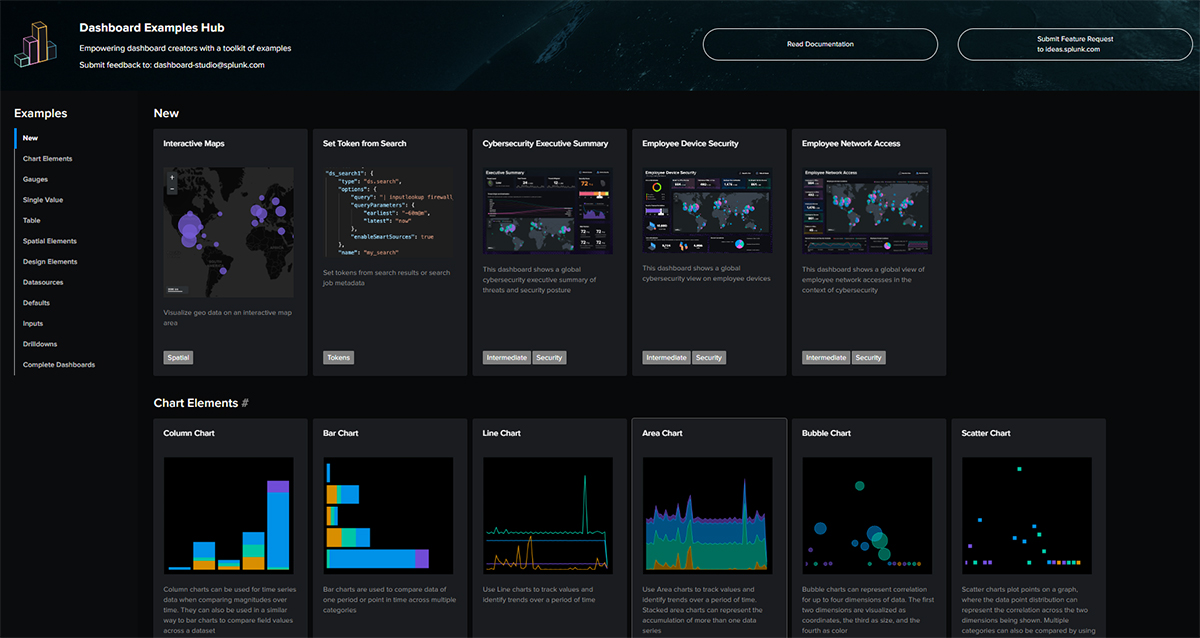 Larger view
The Examples Hub covers all of the visualization items available in Splunk Enterprise, including almost all patterns of the same visualization items that change its appearance with optional parameters. Using these parts will also make it easier to proceed with the mock-up creation.
Implementation
The Examples Hub is also utilized for implementation. Even for complex visualization items, the source code is provided along with them. By simply copying and pasting the code, it is possible to get the same look implementation.
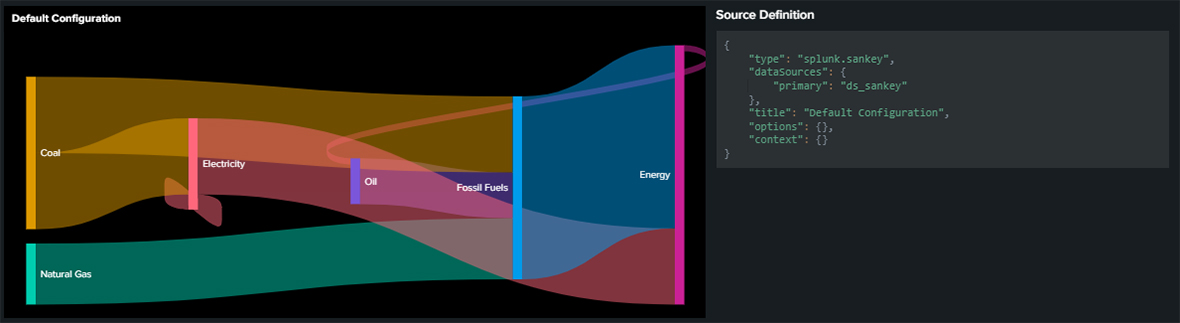 Larger view
If you want to use a different color theme than the Examples Hub in your project, it would be a good idea to prepare the corresponding code in advance. Since the background color of the visualization items and the color used for items in the part are prepared with parameter names with common wording such as "backgroundColor" and "seriesColors", you can easily change the color theme of various visualization items just by having this code ready.
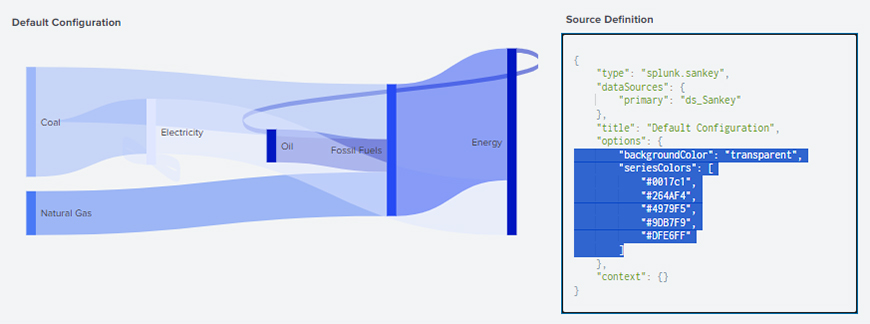 Larger view
If you are unsure about how to name panel titles and other items, "Naming Conventions Best Practices ![]() [6]” provided by Domo may give you some hints. It will provide guidance on how to name the titles that describe the content of the panel.
[6]” provided by Domo may give you some hints. It will provide guidance on how to name the titles that describe the content of the panel.
Similar to the requirements definition worksheet, the "checklist" provided by the Practical Guidebook can be used to check the implementation contents in a layer that is not affected by the dashboard development platform. While there are some items that may be difficult to achieve in the dashboard development platforms such as some layout-related items, most of the items will be helpful during the final touch-up stages of dashboards.
Conclusion
In this article, I have introduced the "Dashboard Design Guidebook" published by the Digital Agency, Government of Japan. I have also introduced some resources provided by other dashboard development platforms that reinforce the development process suggested in the guide. In addition to the resources introduced in this article, there are many other resources from various dashboard development platform vendors. As discussions such as "the materials here are useful" spread on social media, everyone will be able to create more sophisticated dashboards than ever before. I look forward to seeing positive exchange of information.
I hope this blog will be helpful.
Reference
- [1]ダッシュボードデザインの実践ガイドブックとチャート・コンポーネントライブラリ(ベータ版)|デジタル庁
 https://www.digital.go.jp/resources/dashboard-guidebook
 - [2]Power BI - データの視覚化|Microsoft Power Platformhttps://www.microsoft.com/ja-jp/power-platform/products/power-bi
- [3]PLA1583C - Dashboard Design and Best Practices|.conf Onlinehttps://conf.splunk.com/watch/conf-online.html?search=PLA1583C#/
- [4]Best Practices for Choosing Chart Types|Domohttps://domo-support.domo.com/s/article/360042935294
- [5]Splunk Dashboard Studio Examples Hub|Splunkhttps://docs.splunk.com/Documentation/Splunk/Latest/DashStudio/ExHub
- [6]Naming Conventions Best Practices|Domohttps://domo-support.domo.com/s/article/360042935534
Profile
Yoshihiko Koizumi, CISSP, RISS(Registered Information Security Specialist)
Security Engineering Center
After leading the establishment of the NEC Cybersecurity Training Range Practice, He has subsequently engaged in threat intelligence, forensics, Malware Analysis, and penetration testing as response for large-scale international event and cybersecurity response for government and private sector. Currently, He is engaged in the planning, development, and operation of the NEC Cyber Security Dashboard, with the aim of enhancing security awareness among all NEC group employees.
He holds the 5×Splunk Boss of the SOC trophy and 3× Tanium medals.
His qualifications include CISSP and RISS(Registered Information Security Specialist).