Financial Highlights
NEC CORPORATION AND CONSOLIDATED SUBSIDIARIES
For the years ended March 31, 1995, 1996 and 1997
In thousands of Percent
In millions of yen U.S.dollars change
------------------------------------- ---------------
1995 1996 1997 1997 1997/1996
---------------------------------------------------------------------------------------------------------------------------
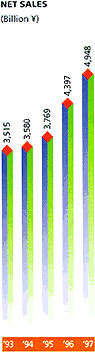
Net sales ............................................ Y3,769,357 Y4,397,192 Y4,948,437 $39,906,750 13%
C&C operations ...................................... 3,591,010 4,202,857 4,728,250 38,131,048 13
Communications systems and equipment ............... 1,027,118 1,227,016 1,686,594 13,601,565 37
Computers and industrial electronic systems ........ 1,789,394 1,942,858 2,078,480 16,761,935 7
Electron devices ................................... 774,498 1,032,983 963,176 7,767,548 -7
Other operations .................................... 178,347 194,335 220,187 1,775,702 13
----------------------------------------------------------------------------------------------------------------------------
Income before income taxes ........................... 74,724 151,318 121,222 977,597 -20
----------------------------------------------------------------------------------------------------------------------------
Income taxes ......................................... 51,448 76,376 24,900 200,806 -67
----------------------------------------------------------------------------------------------------------------------------
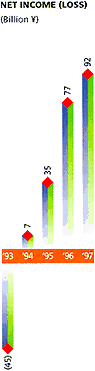
Net income ........................................... 35,316 77,166 91,581 738,556 19
----------------------------------------------------------------------------------------------------------------------------
Per share of common stock (in yen and U.S. dollars):
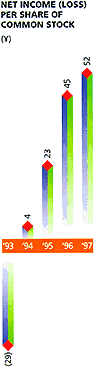
Net income .......................................... 22.92 45.21 51.78 0.418 15
Cash dividends ...................................... 10.00 11.00 11.00 0.089 0
----------------------------------------------------------------------------------------------------------------------------
Per American Depositary Share, each representing
5 shares of common stock (in yen and U.S. dollars):
Net income .......................................... 115 226 259 2.09 15
Cash dividends ...................................... 50 55 55 0.44 0
----------------------------------------------------------------------------------------------------------------------------
Total assets ......................................... 4,151,320 4,683,120 4,799,165 38,702,944 2
----------------------------------------------------------------------------------------------------------------------------
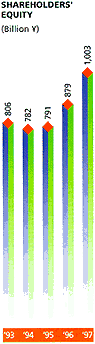
Shareholders' equity ................................. 790,749 878,852 1,003,371 8,091,702 14
----------------------------------------------------------------------------------------------------------------------------
Capital expenditures ................................. 300,220 401,999 432,962 3,491,629 8
----------------------------------------------------------------------------------------------------------------------------
R&D expenses ......................................... 266,006 298,713 348,537 2,810,782 17
----------------------------------------------------------------------------------------------------------------------------
Employees ............................................ 151,069 152,719 151,966 0
----------------------------------------------------------------------------------------------------------------------------
- Notes:
- 1. U.S. dollar amounts are translated from yen, for convenience only, at the rate of Y124=U.S.$1.
- 2. Computation of net income per share is based on the average number of shares of common stock outstanding during each year, with consideration of the dilutive effect of common stock equivalents.
HOME
NEXT